Overview
- Video length: 4:50.
- This video was created with ArcGIS Pro 2.3.
Geographic data often has an important temporal component. Temporal data—information about features and attributes at different points in time—can help you explore phenomena as diverse as crime trends, the spread of an invasive species, and traffic accident patterns.
In this tutorial, you'll visualize changes in international tourism in New Zealand over the past twenty years—changes that have major business implications for the country. Optionally, you'll export your visualization as a video file that can be shared to social media platforms.
- Estimated time: 40 minutes, 50 minutes with optional section
- Software requirements: ArcGIS Pro
Open the project
Tourism is an important and rapidly growing part of New Zealand's economy. It currently generates over 6 percent of the country's GDP and is a major employer. Knowing where tourists come from, which parts of New Zealand they visit, and how long they stay helps planners choose the right locations for hotels, tour companies, and other services.
In this tutorial, you'll visualize changes in the Chinese tourism market in New Zealand. China recently became the second most important tourist market for New Zealand and is expected to surpass Australia as the largest source of visitor revenue within a few years. You'll use data from New Zealand's International Visitors Survey over a 20-year period to map this increase.
- Start ArcGIS Pro and sign in if necessary.
- On the start page, under your recent projects, click Open another project.
Note:
If you already have a project open, click the Project tab on the ribbon. In the list of menu items on the left, click Open. On the Open page, click Portal and click Open another project at the bottom of the page.
- On the Open Project dialog box, under Portal
 , click ArcGIS Online
  .
.Note:
If you see ArcGIS Enterprise
 listed instead, you must set your active portal to ArcGIS Online or download the tutorial data from a browser. Learn more about how to access the quick-start tutorials.
 - At the top of the dialog box, in the Search box, type Visualize temporal data tutorial and press Enter.
- In the list of search results, click Visualize temporal data to select the project package.
Note:
If there is more than one project package with this name, look at the Owner column. Select the item with the owner name ArcGISProTutorials. If no search results are returned, see Access the quick-start tutorials.
- Click OK.
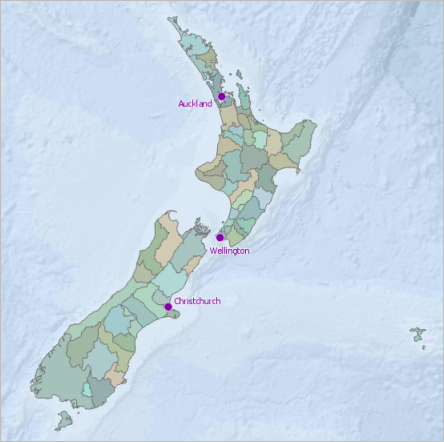
The project opens with a map of New Zealand's territorial authority boundaries. Territorial authorities are the second tier of local government in New Zealand, below regional councils. They may represent either cities or local administrative districts.
By default, project packages are unpacked to your <User Documents>\ArcGIS\Packages folder. You can change the default location in the Share and download options.
Add an Excel worksheet to the project
The Chinese tourism data is found in an Excel file attached to the project package. You'll add a worksheet from the file to your project as a table.
- On the ribbon, click the View tab. In the Windows group, click Reset Panes
 and click Reset Panes for Geoprocessing.
This ensures that the Contents, Catalog, and Geoprocessing panes are open and that other panes are closed.
- On the ribbon, click the Map tab. In the Layer group, click Add Data
 .
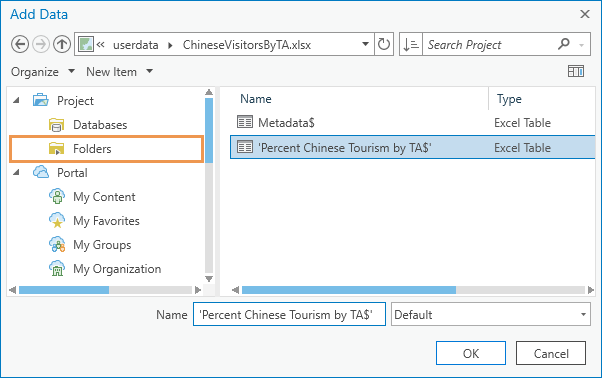
. - On the browse dialog box, under Project, click Folders to select folders associated with the project.
- In the window on the right, browse to Visualize_temporal_data > common data > userdata. Double-click ChineseVisitorsByTA.xlsx and click the 'Percent Chinese Tourism by TA$' worksheet to select it.
Note:
If you receive an error message that the required Microsoft driver is not installed, see Work with Microsoft Excel files in ArcGIS Pro for more information and a link to the driver. After installing the driver, click the Refresh button
 on the browse dialog box to display the worksheet.
 - Click OK.
The Excel sheet is added as a table to ArcGIS Pro and appears in the Contents pane.
- In the Contents pane, under Standalone Tables, right-click 'Percent Chinese Tourism by TA$' and click Open
 .
.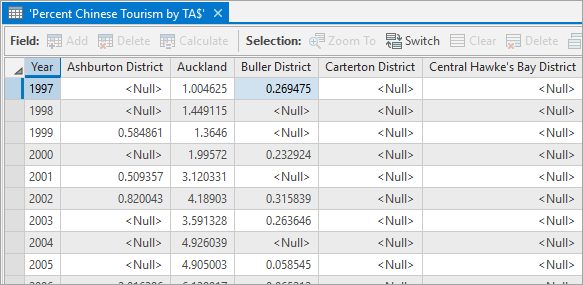
Each column in the table lists a different territorial authority. Each row lists a year from 1997 to 2017. Cell values represent tourists from China as a percentage of all international tourists. Null values indicate missing or insufficient data—they do not indicate values of zero.
Note:
The Excel file (.xlsx) is stored by default in your <user documents>\ArcGIS\Packages\Visualize_temporal_data\commondata\userdata folder. The Metadata worksheet in the Excel file contains a link to the source data (which has been modified) and more information. This work is based on/includes Stats NZ’s data, which are licensed by Stats NZ for reuse under the Creative Commons Attribution 4.0 International license.
- On the Quick Access Toolbar, click Save
 to save the project.
Transpose table fields
In the 'Percent Chinese Tourism By TA$' table, the temporal units (years) are rows and the geographic units (territorial authorities) are columns. In another table, you might find that the rows are geographic units and the columns are temporal units. In either case, temporal data in ArcGIS works best when unique spatiotemporal values are stored as separate rows in a single column.
This table has 21 rows for years and 64 columns for territories. You need to create a table that stores a row for each of the 1,344 (21 x 64) unique combinations of year and territory. You'll use the Transpose Fields tool to put the data into this format.
- In the Geoprocessing pane, type Transpose Fields in the search box.
As you type, search results are returned. The first result should be the Transpose Fields tool.
- In the list of search results, click Transpose Fields to open the tool.
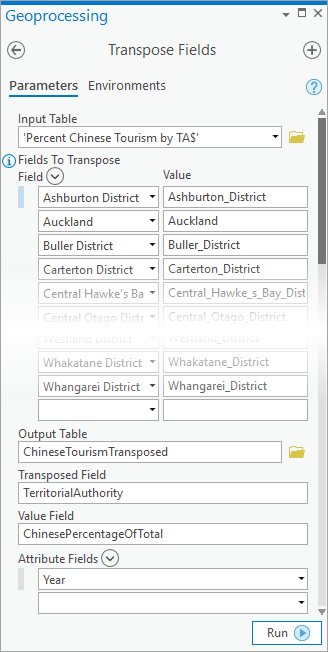
- For Input Table, click the drop-down arrow and click 'Percent Chinese Tourism By TA$'.
- Under Fields to Transpose, next to Field, click the Add Many button
 .
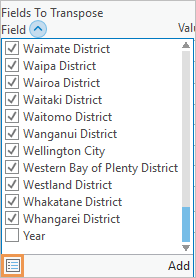
. - At the bottom of the drop-down list, click the Toggle All Checkboxes button
 to select all the fields. Scroll to the bottom of the list and uncheck Year.
- At the bottom of the drop-down list, click Add.
These fields will become rows in the output table.
- Scroll to the bottom of the Geoprocessing pane. For Output Table, delete the entire path and type ChineseTourismTransposed.
The path to your project geodatabase will be restored automatically.
- For Transposed Field, type TerritorialAuthority.
- For Value Field, type ChinesePercentageOfTotal.
Note:
The Transposed field is a new field in the output table that will store the names of the territorial authorities. The Value field is a new field that will store the Chinese tourism percentage values. You can use any names you want for these fields.
- Click the Attribute Fields drop-down arrow (not the Add Many button
 ) and click Year.
- Click Run
 .
.A new table is added to the Contents pane. You'll confirm that the table has been saved to your project geodatabase.
- In the Catalog pane, expand Databases and expand the visualize_temporal_data geodatabase.
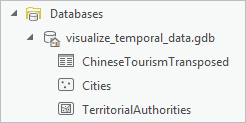
The project geodatabase contains three items: the table you created and two feature classes that are the source datasets of layers in the map.
Tip:
If you don't see the table, right-click the project geodatabase and click Refresh
 .
. - Close the 'Percent Chinese Tourism by TA$' table.
- In the Contents pane, under Standalone Tables, right-click ChineseTourismTransposed and click Open
 .
. - Scroll through the table.
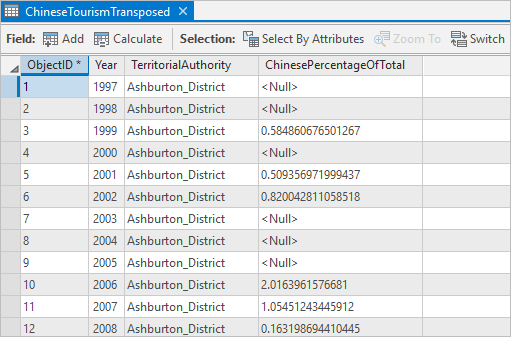
The output is what you want: a separate row for each unique combination of year and territory. However, not all the fields have the proper data type.
- Hover over the ChinesePercentageOfTotal field heading.
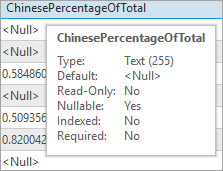
The field values represent percentages, but the field data type is Text. You need a numeric field that displays decimal points. Since you can't change the data type of a field, you'll add a new field and populate it with the same values.
Note:
When an Excel table is processed in ArcGIS Pro, fields that contain values of mixed data type—including a combination of numbers and null values—are output as text fields. For more information, see Work with Microsoft Excel files in ArcGIS Pro.
- Hover over the Year field heading.
The data type for this field is Double, a numeric type that supports numbers with high-precision decimal values. Although you can display temporal data when the time values are stored as numbers (or text, for that matter), the best practice is to store them in a date field. You'll run a tool to convert the year values to dates.
Learn more about ArcGIS field data types.
Add a field and calculate its values
You'll add a numeric field to the table and calculate the tourism percentage values, currently stored as text, into it.
- In the Contents pane, click the ChineseTourismTransposed table to select it, if necessary.
- On the ribbon, under Table, click the View tab. (Click the highlighted contextual tab, not the core View tab.)
- In the Field group, click Add
 .
.The Fields view of the table opens. You use the Fields view to work with table properties. In the Fields view, each field in the ChineseTourismTransposed table is presented as a row. Each table property is presented as a column. In the last row of the Fields view, a new field named Field has been added.
- In the last row of the Fields view, in the Field Name column, double-click the name Field to make it editable. Change the field name to ChinesePercentage and press Enter.
- In the same row, in the Data Type column, double-click the default value Long. In the drop-down list of data types, click Float.
Like Double, the Float data type supports decimal places, but it uses less storage space.
- On the ribbon, on the Fields tab, in the Changes group, click Save
 .
.This saves your changes to the table properties.
- Close the Fields: ChineseTourismTransposed view.
The new field displays in the ChineseTourismTransposed table with <Null> values. Now you'll calculate values for the field.
Tip:
If you don't see the new field in the table, click the Refresh Table button
 at the bottom of the table view.
 - In the table, right-click the column heading of the ChinesePercentage field and click Calculate Field
 .
.The Calculate Field window appears. The Input Table, Field Name, and Expression Type parameters are set correctly.
Note:
For convenience, some geoprocessing tools open in a floating window. These tools can also be opened in the Geoprocessing pane.
- In the Fields list, double-click ChinesePercentageOfTotal.
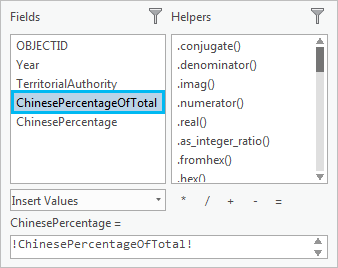
The field name is added to the expression box under the list of fields. The complete field calculation reads ChinesePercentage = !ChinesePercentageOfTotal!. (The exclamation points are Python syntax.)
When the tool runs, the ChinesePercentage field will have the same values as ChinesePercentageOfTotal, but they will be numbers instead of text.
- Click OK.
The ChinesePercentage field is populated with numeric values expressed to six decimal places.
- Click the column heading of the ChinesePercentageOfTotal field (the text field) to select it. Right-click the selected heading and click Delete
 .
.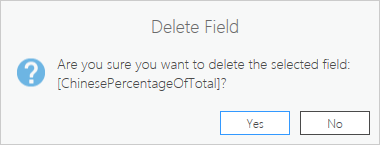
- On the Delete Field prompt, confirm that you are deleting the correct field. Click Yes.
- Click Save
 to save the project.
Convert time values to date format
It's a good practice to put time values in date fields. Although it's not necessary for this tutorial, some advanced analysis operations require it.
- In the Geoprocessing pane, click the Back button
 .
. - In the search box, type Convert Time Field.
- Open the Convert Time Field tool. (It should be the first search result.)
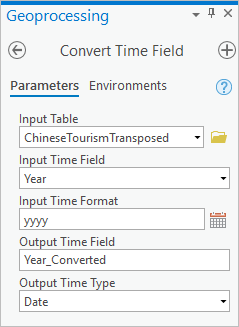
- Set Input Table to ChineseTourismTransposed.
- Set Input Time Field to Year.
- For Input Time Format, click the Set Format button
 . Click the Date Format drop-down arrow and click yyyy. Ignore the Locale setting.
 - Accept Year_Converted for the Output Time Field and confirm that the Output Time Type parameter is set to Date.
- Click Run
 .
.The new field is added to the table and populated with dates.
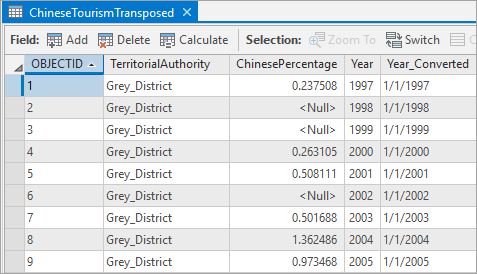
- Delete the Year field.
- Click Save
 to save the project.
Join the table to the layer
To create a temporal display, you need to join the ChineseTourismTransposed stand-alone table to the Territorial Authorities layer in the map. A join temporarily connects tables, so that attributes from one table (usually a stand-alone table) can by queried or symbolized as if they belonged to another table (usually a layer attribute table).
A join requires that the two tables have a common attribute. In this case, both the Territorial Authorities layer attribute table and the ChineseTourismTransposed table have a field containing the names of territories.
There are 68 records in the Territorial Authorities table (the target table) and 1,344 records in the ChineseTourismTransposed table (the join table). Because one record in the target table will match many records in the join table—all records with the same territory name will match—the join is called a one-to-many join. Learn more about joins.
- In the Contents pane, right-click the Territorial Authorities layer and click Attribute Table
 .
.There is one record for each territory. Notice that the values in the Name field have underscores rather than spaces between words.
- Make the ChineseTourismTransposed table active.
Names in the TerritorialAuthority field are also separated by underscores. It's not necessary that the names (or aliases) of the common field be the same in both tables. However, it is necessary that the field values be formatted the same way.
- Close the ChineseTourismTransposed table.
- In the Contents pane, right-click the Territorial Authorities layer, point to Joins and Relates, and click Add Join
 .
.The Add Join window appears.
- In the Add Join window, set the parameters as follows:
- For Input Table, accept Territorial Authorities.
- For Input Join Field, choose Name.
- For Join Table, choose ChineseTourismTransposed.
- For Join Table Field, choose TerritorialAuthority, if necessary.
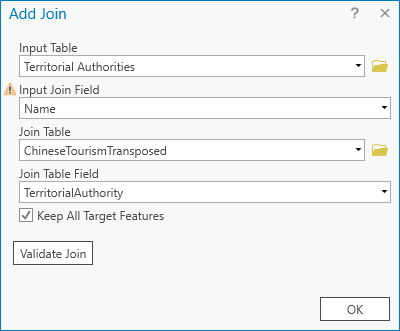
A warning on the Input Join Field parameter indicates that the join field is not indexed. With a very large number of records, an attribute index would improve performance. You don't need an index in this case.
- Click OK.
When the tool finishes, the Territorial Authorities attribute table updates. The attributes from the ChineseTourismTransposed table are appended to the table.
Note:
The joined table has 1,348 records. Four of the original 68 records in the layer attribute table didn't have matching records in the ChineseTourismTransposed table. (Recall that 64 territorial authorities were represented in the original Excel worksheet.) For the four unmatched records, null values are assigned to the joined fields.
- Scroll across the table.
Some of the attributes aren't needed. Rather than deleting them, you'll hide them.
- In the attribute table, right-click any column heading and click Fields
 to open the Fields view of the table.
 - In the Visible column, uncheck the check box in the column heading to turn off the visibility of all fields in the table.
- Check the Visible check boxes next to the following fields to make them visible:
- TA2015_NAME (with the alias Name)
- ChineseTourismTransposed.ChinesePercentage (with the alias ChinesePercentage)
- ChineseTourismTransposed.Year_Converted (with the alias Year_Converted)
Note:
The prefix ChineseTourismTransposed. indicates that these fields come from the joined table. The join applies only to the map layer, not to its source feature class. You can make a join permanent by exporting the layer to a new feature class.
- On the ribbon, on the Fields tab, in the Changes group, click Save
 .
. - Close the Fields: Territorial Authorities view.
The Territorial Authorities table displays three fields: Name, ChinesePercentage, and Year_Converted.
Tip:
If necessary, click the Refresh Table button
 at the bottom of the table view.
 - Close the table.
- Click Save
 to save the project.
Symbolize the territorial authorities
On the map, the territories are symbolized by unique values. You'll switch to a graduated color scheme and use lighter and darker hues to represent lower and higher percentages of Chinese tourists.
- In the Contents pane, right-click the Territorial Authorities layer and click Symbology
 .
.The Symbology pane opens.
- Under Primary symbology, click the drop-down arrow and click Graduated Colors.
The field to symbolize is automatically set to ChinesePercentage (the only available numeric field).
- Click the Color scheme drop-down arrow. Under the list of color schemes, check the Show names check box.
- Scroll through the list of color schemes. Near the bottom, click Yellow-Orange-Red (5 Classes) to select it.
By default, the data is grouped into five classes. The class breaks reflect value clusters in the data (natural breaks), but are not intuitive to a map reader. You'll change the class break values.
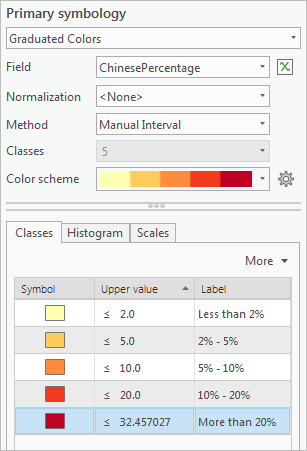
- In the lower part of the Symbology pane, on the Classes tab, edit the Upper value and Label columns as shown in the table below. Click twice to make a cell editable. To commit an edit, press Tab or Enter, or click in a different cell.
Upper Value Label 2
Less than 2%
5
2% - 5%
10
5% - 10%
20
10% - 20%
Leave unchanged
More than 20%
Your Symbology pane should look like this:
On the map, the Territorial Authorities layer reflects the new color scheme. The colors look faint because transparency was applied to the original symbology.
- In the Contents pane, make sure the Territorial Authorities layer is selected. On the ribbon, under Feature Layer, click the Appearance tab. In the Effects group, move the transparency slider to 0%.
- In the Contents pane, turn off the Cities layer.
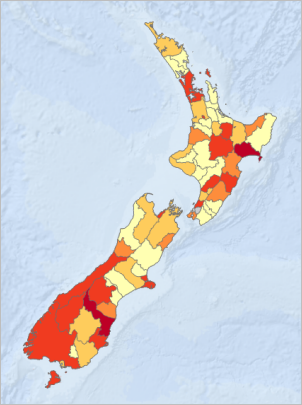
At the moment, only one value is symbolized for each feature on the map. To see the data change year by year, you'll enable time on the layer.
- Click Save
 to save the project.
Enable time and visualize the data
The display of temporal data is controlled with a time slider that's similar to a video player. A contextual Time tab on the ribbon provides more settings for displaying the data. The time slider and ribbon tab become available when you enable a layer's time property.
- In the Contents pane, right-click the Territorial Authorities layer and click Properties
 .
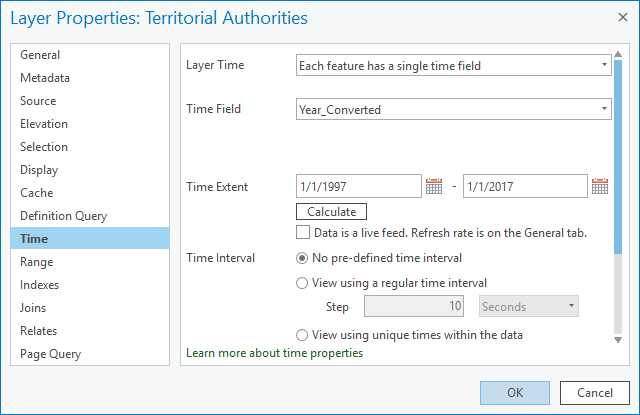
. - On the Layer Properties dialog box, in the tabs on the left, click Time.
- In the time properties, click the Layer Time drop-down arrow and click Each feature has a single time field.
Time Field is automatically set to Year_Converted, and Time Extent is set to the range of the data.
- Click OK.
The time slider appears at the top of the map view.
- Hover over the time slider to see its controls.

- On the left side of the time slider, click the Time disabled button
 to turn it to the Time enabled button
  .
.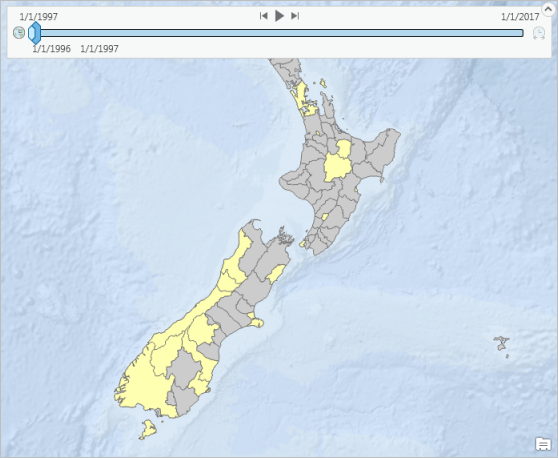
The time span collapses to the first value in the range. In 1997, Chinese tourists did not make up more than 2 percent of international visitors to any territory. Many territories have null values for that year—that's where you see the gray Background layer symbol.
You'll configure the time slider to play back the data in one-year intervals.
- On the ribbon, under the contextual Map tab, click the Time tab. In the Snapping group, check the Time Snapping check box. Under the check box, click the Time Snap Interval drop-down arrow and click Years.
This setting corresponds to the resolution of the data, which was captured at yearly intervals.
- In the Current Time group, change the Span setting to 0 and press Enter.

This ensures that only one year's worth of data displays at a time. To learn more about configuring time, see Configure time slider settings.
- In the Playback group, click the Play All Steps button
 .
.The map plays through the data, displaying the percentage of Chinese tourists in each year. In the last few years of playback, there is a noticeable increase—especially on the South Island.
Tip:
You can also play the data by clicking the Play All Steps button
 on the time slider.
 - In the Playback group, use the Adjust Playback Speed slider to decrease the speed. Play the data again.
- Click Save
 to save the project.
Create an animation and export a video (optional)
In this section, you'll create an animation of the playback and export it as a video file. This allows you to share your work with others, such as business owners and stakeholders in the tourism industry, who may not have access to ArcGIS Pro.
Animations are composed of keyframes, which are like stations or waypoints, and the transitions between them. Now that you have configured time properties for the Territorial Authorities layer, you can import the time slider steps (one step per year) to the animation. Each time step becomes a keyframe.
To learn more about animation, see Animation basics.
- On the ribbon, click the View tab. In the Animation group, click Add
 .
.An animation is created for the current map. The blank Animation Timeline pane appears under the map view. On the ribbon, under Map, a contextual Animation tab appears.
Before you create keyframes for the animation, you'll make sure that you're zoomed to the correct map extent.
- In the Contents pane, right-click the Territorial Authorities layer and click Zoom To Layer
 .
. - On the ribbon, under the contextual Map tab, click the Animation tab if necessary. In the Create group, click the Import
 drop-down arrow and click Time Slider Steps
  .
.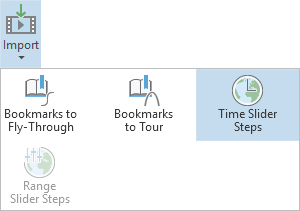
The Animation Timeline pane populates with 22 keyframes. The first keyframe represents the animation at zero seconds (00:00.000). Each subsequent keyframe corresponds to the data for one year. (It may take a few moments for the thumbnail images to display in the keyframes.)
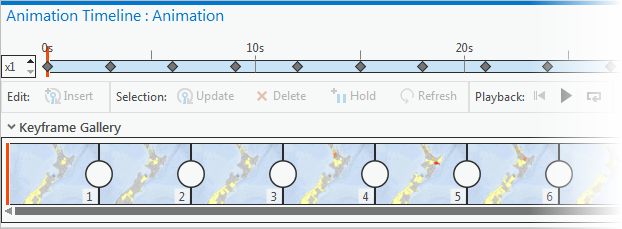
On the Animation tab, in the Playback group, the Duration setting is one minute and three seconds (01:03.000). There are 21 slide transitions, which means each slide is visible for three seconds. Since there is no camera movement (your viewpoint in relation to the map doesn't change), you don't need that much time between keyframes. You'll shorten the duration to make the video more visually effective.
- On the Animation tab, in the Playback group, replace the duration value with 00:21, and press Enter.
The time stamps in the Animation Timeline pane are adjusted. Each transition now takes one second.
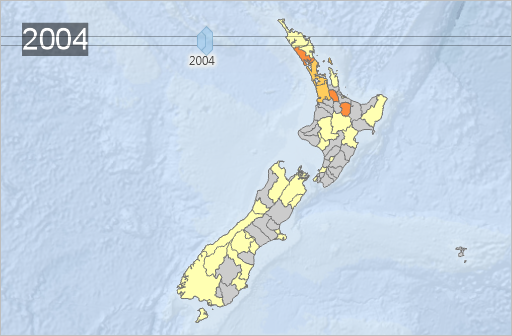
It would be helpful if the animation showed which year the data represents. You'll add dynamic text to show this. Dynamic text is information that updates during playback.
- In the Animation Timeline pane, under Keyframe Gallery, click the first keyframe to select it. Scroll to the end of the gallery, press Shift, and click the last keyframe.

The dynamic text you add in the next step will be applied to all the selected keyframes—in other words, throughout the animation.
- On the Animation tab, in the Overlay group, expand the Overlay gallery.

Note:
Depending on the size of your ArcGIS Pro window, you may see an Add Overlay button
 rather than gallery items. Click the button to display the gallery.
 - In the Overlay gallery, under Dynamic Text, click Map Time
 .
.A box with a dynamic text expression appears as an overlay on the map view.
- In the dynamic text box, replace the default two-line expression with <dyn type="animation" property="startTime" format="yyyy"/>.

The expression creates a single time label, rather than a start and end time, and formats it to display the year rather than a full date.
- On the map view overlay, click Close
 to commit your edits.
You'll make the dynamic text larger. Then you'll preview the animation.
- On the Animation tab, in the Overlay group, change the font size to 48.
Tip:
Options to format and symbolize overlays are found on the Overlay tab of the Animation Properties pane. This animation could be further enhanced with a title
 and other overlays. Learn more about adding animation overlays and editing animation overlays.
 - In the Playback group, click the Play button
 . (Don't click the Play button on the time slider—changes you've made to the animation are not reflected in the time slider playback.)
You're ready to export the animation as a video file.
- On the Animation tab, in the Export group, click Movie
 .
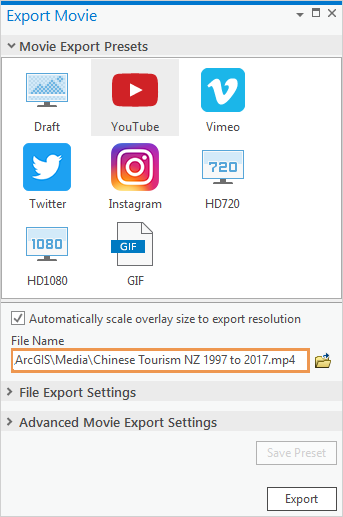
.The Export Movie pane opens. The default settings output a video configured for YouTube in .mp4 media format. You can experiment with other movie export presets and settings if you like.
- In the Export Movie pane, in the File Name box, change the default file name (New Zealand) to Chinese Tourism NZ 1997 to 2017.
- Optionally, click the Browse button
 and browse to a different folder to save the video.
 - Click Export.
The export takes some time. You can track the progress at the bottom of the pane. When the process is finished, a Play the Video link appears in the lower left corner of the pane.
- Click Play the Video.
- Click Save
 to save the project.
In this tutorial, you created a dynamic temporal visualization in ArcGIS Pro. You added an Excel worksheet to your project and ran geoprocessing tools to transpose and calculate fields. You joined the stand-alone output table to a feature layer, symbolized the layer, and configured its time settings. If you did the optional section, you imported the time steps as an animation and exported the animation as a video.
Dynamic displays can draw attention to important patterns. In this case, visualizing the Chinese tourist market in time and space can help business analysts see where significant changes are occurring and where new tourism efforts should be focused.
More sophisticated analysis of temporal data can be done with the tools in the Space Time Pattern Mining toolbox. For an advanced tutorial using temporal data analysis, see Analyzing traffic accidents in space and time.
