Available with Spatial Analyst license.
Density analysis takes known quantities of some phenomenon and spreads them across the landscape based on the quantity that is measured at each location and the spatial relationship of the locations of the measured quantities.
Density surface
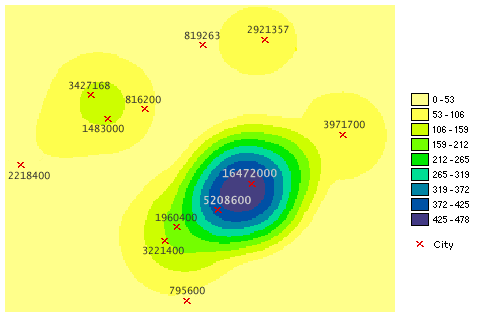
Density surfaces show where point or line features are concentrated. For example, you might have a point value for each town representing the total number of people in the town, but you want to learn more about the spread of population over the region. Since all the people in each town do not live at the population point, by calculating density, you can create a surface showing the predicted distribution of the population throughout the landscape.
The following graphic is an example of a density surface. When added together, the population values of the cells equal the sum of the population of the original point layer.

Density analysis applications
The density tools distribute a measured quantity of an input point layer throughout a landscape to produce a continuous surface.
For example, a retail store chain has multiple stores in a particular district. For each store, management has customer sales figures. Management assumes that customers patronize one store over another based on how far they have to travel. In this example, it is natural to assume that any single customer will always choose the closest store. The farther away a customer is from the closest store, the farther the customer must travel to that store. But shoppers farther away may also shop at other stores. Management wants to study the distribution of where the customers live. From the sales figures and the spatial distribution of the stores, management wants to create a surface of customers by intelligently spreading the customers across the landscape.
To accomplish this, the density tool determines where each store is in relation to other stores, the quantity of customers shopping at each store, and how many cells need to share a portion of the measured quantity (the shoppers). The cells nearer the measured points (the stores) receive higher proportions of the measured quantity than those farther away.