In many cases, .las files may not be fully or correctly classified when used with ArcGIS Pro, and you may need to manually edit the classification of the LAS points. The Classification tab allows you to interactively change the classification conducted on the .las file, .zlas file, or LAS dataset in a map or scene. You can interactively change the class codes and classification flags that are currently set on the selected points.
You can edit the classified points directly in a 2D map or 3D scene, or optionally shift your scene into a side-on viewpoint using profile viewing in a 3D scene.
You can only interactively edit the classification that is currently defined in the .las, or .zlas files referenced by the LAS dataset. When you modify the classification codes in these file on disk, the changes you make are permanent. If you are conducting trial scenarios, or do not want changes to be permanent, work with a copy of the files and not the original data. You can also use the Extract LAS geoprocessing tool to extract a portion of a .las file or .zlas file to conduct an initial test.
Selection
There are several options to select points from a 2D map or 3D scene view. When classifying lidar points, it is helpful that the data be displayed at full resolution. In a 2D map view, the selection tools are enabled when the LAS dataset is displayed at full resolution. You can check that the data percentage is at 100 percent for the LAS dataset layer in the Contents pane. You can tell if the points are at full resolution once a selection tool has been selected. In a 3D scene view the points do not have to be at full resolution to be selected.
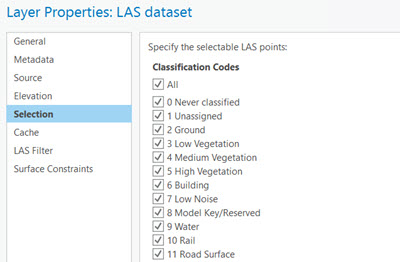
Click Selectable Points  to open the layer properties of the LAS dataset, .las file or .zlas file. From the layer properties dialog box, you can specify which points are selectable for the LAS dataset layer. The classification codes in the LAS dataset are listed on the Selection tab. You can make certain classification codes selectable using the check boxes. This is useful when you are interactively classifying points. For example, you may want only the unclassified points to be selectable points to reclassify certain features that are currently unclassified points. You can also access the Selection tab by clicking Selectable Points
  on the Classification tab, in the LAS Dataset Layer tab group.

The Visible Points button  selects only the points you can see, not the obscured points. This prevents the unintentional selection of points that may be far in the background.
You can select points interactively using any of the selection tools listed in the table below. When you click the select button  , you see a list of the selection tools. Press the C key to use the Explore tool while you are using any of the selection tools.
| Selection tool | Description |
|---|---|
Rectangle | Selects points based on a digitized rectangle |
Polygon | Selects points based on a digitized polygon |
Lasso | Selects points based on a digitized lasso |
Circle | Selects points based on a digitized circle |
Line | Selects points based on a digitized line |
Box | Selects points based on a 3D box |
Sphere | Selects points based on a 3D sphere |
Cylinder | Selects points based on a 3D cylinder |
Power Line | A smart selection tool that selects a series of points along a line based on a smaller selection, such as points along a power line |
3D selection tools
There are three 3D volumetric tools for selecting points in a 3D view. You can select using a box, sphere, or cylinder. The 3D volumetric selection tools only select features that are visible in the view.
- Box
 (3D only)—Click to set the first corner of the box. Move the pointer and click to add the vertices for the next two corners creating the front and side edges of a rectangular plane. Move the pointer again and click to set the box height. Optionally, press the R key to enter precise reach distances for each dimension of the box. When using the R key for the first edge of the box, you must click after entering the reach distance value to define the box orientation.
 - Sphere
 (3D only)—Click once to set the center of the sphere. Set the size of the sphere by either moving the pointer and clicking a second time or pressing R and entering a radius value.
 - Cylinder
 (3D only)—Click to set the center of one end of the cylinder. Move the pointer and click again to set the other end of the cylinder. Move the pointer and click to set the radius of the cylinder. Optionally, press the R key to enter precise reach and radius distances for the cylinder shape. When using the R key for the length of the cylinder, you must click after entering the reach distance value to define the cylinder's 3D orientation.
Power Line selection tool
The Power Line selection tool is a smart selection tool that selects a series of points along a line based on a smaller selection or by double-clicking power line points in a 3D scene. When you select a few points or double-click points along a power line, the tool automatically selects several points along the line until the parameters are exceeded. Once points are selected, they can be reclassified to the power line classification code. It is best to zoom in as closely to the points as possible to ensure that you are selecting the points along a line. You may need your camera position to be below the lines for the best results in 3D. Consider using the Selectable Points option to select only the points that are assigned a certain class code.

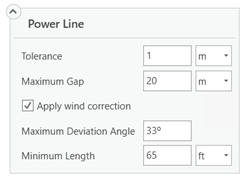
The Tolerance value is the maximum distance in 3D that the points used to model the power line can be from one another. The value you use should have a relationship to the positional accuracy of the lidar points in x,y and z-dimensions. With more accurate data, use a smaller value; with less accurate data, use a larger value. The Maximum Gap parameter allows gaps in the smart selection modeling. Portions of power lines may not have any lidar returns. These are gaps in the data that may exceed the specified tolerance. Applying a Maximum Gap value allows the modeling to continue across gaps, up to the specified distance, to find more points for a given power line.
If the lidar data was collected during high wind, the power lines may not demonstrate the typical catenary curve that power lines show. Check the Apply wind correction check box to apply wind correction parameters to the power line selection tool. High wind can swing a power line in one direction at an angle. The Maximum Deviation Angle value is the maximum angle that the power line can rotate from the center. The Maximum Length value is the maximum length that the modeling will correct for wind with power lines longer than this distance.
Note:
In some cases, selecting and reclassifying power lines is better handled in a profile view rather than with the Power Line selection tool. If you have towers with many power lines on them, you can select all the lines in a span all at once.
Classify LAS points interactively
To interactively select and edit LAS points, do the following:
- Select a LAS dataset, .las file, .zlas file layer in the Contents pane.
- Browse to the location to select and edit points.
- Under LAS Dataset Layer, click the Classification tab.
- Optionally, use the tools in the Profile Viewing group to create a profile view of the extent of the points to be classified.
For more information on profile viewing, see Profile viewing.
- Click the Select drop-down menu and choose a selection tool.
- Select the points to be edited.
- In the Interactive Edit group, click the Classification Codes drop-down arrow and choose the new classification code for the selected points. You can also set or clear classification flags. Select the classification flag and click either Set or Clear from the drop-down menu.
- Click Apply Changes to commit the edits.
All changes are permanent and cannot be undone.
Note:
You can click Clear to clear any selected points.


