The network locations of analysis inputs can be visualized in the map using the Explore Locations tool  .
.
Visualizing the network locations of inputs is valuable for understanding and troubleshooting network analysis results.
When you perform a network analysis, the inputs to your analysis rarely fall exactly on top of the edges or junctions of the network data source you are using. For example, you may be using a network dataset constructed from street center lines, but the points you want to analyze are the centroids of parcels in your city. These parcel centroids do not fall on top of the street center lines; rather, they are offset some distance from the streets. To successfully perform a network analysis, you must determine the location on the network dataset where each analysis input lies. This network location, rather than the input's original location, is used in the analysis.
The Explore Locations tool can be used to do the following:
- Troubleshoot failed solves or unexpected analysis results
- Diagnose locating problems
- Experiment with the results of changes to locate settings
Learn more about network location fields
When you inspect an analysis input using the Explore Locations tool, the input's network location is shown graphically in the map, and its location fields are shown in a pop-up overlay. The following sections explain these features in more detail.
Explore locations overlay
When you click an analysis input with the Explore Locations tool, the explore locations overlay shows detailed information about the input’s network location and location status. Use this information to better understand the network location. The data grid shows the selected network locations, grouped by their sublayer. For each selected location, its ObjectID (OID), Name, Location Status, and Distance to Network are shown. This information is pulled from the OID, Name, Status, and DistanceToNetworkInMeters fields from the network analysis sublayer. Learn more about network location fields .
Additionally the overlay includes additional functionality to explore the network location in the map and in the network analysis layer sublayer attribute tables.
 —Flash the located network position of the active input location analysis point feature.
 —Pan to the active explored input location analysis point feature.
 —Zoom to the active input location analysis point feature and its located position.
- Select the active input location analysis point feature.
- Load the selected input location analysis features.
 —Clear explored input location analysis point feature results.

Identify network locations in the map display
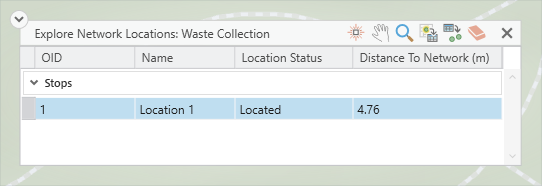
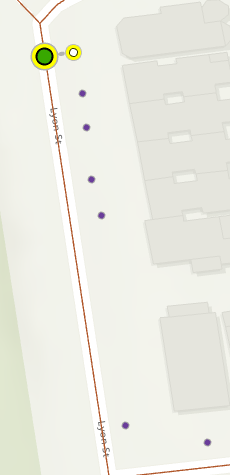
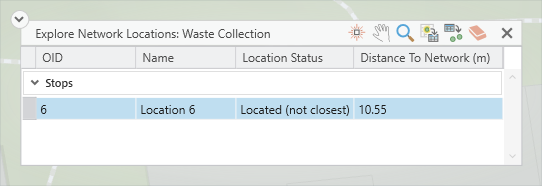
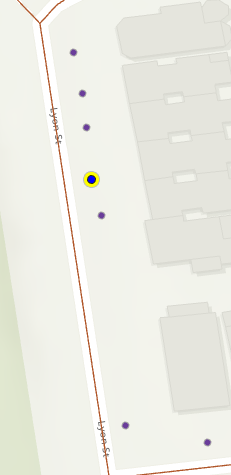
The table below illustrates the behavior of the Explore Locations tool for several locating situations. The left column shows the Explore Locations overlay, and the right column shows the image of the Explore Locations map graphics.
| Explore locations overlay | Identified locations |
|---|---|
The Located status indicates that the network location is on the closest street.
|
|
The Indeterminate status indicates that the point geometry has not been located since creation. Locating happens during the running of the Add Locations tool and at solve time.
|
|
The Not Located status indicates that the network location could not be determined given the current location settings. The point may be outside the given search tolerance or in the wrong location entirely.
| |
The Located (not closest) status indicates that the network location is not on the closest street to the point geometry. This could be due to a restriction on the closest street or because of a barrier feature.
|
|
The Located (at origin) status indicates that network location is at the origin of the coordinate system (0,0). This occurs when using Add Locations using network location fields. The SourceID, SourceOID, and PosAlong fields are populated by Add Locations, but the SnapX and SnapY fields are left at their default values of 0.
|
|
Keyboard shortcuts
Reference the below table to see the keyboard shortcuts that can be used when the data grid in the overlay has a focus
| Keyboard shortcut | Action |
|---|---|
F | Flash the located network position of the active input location analysis point feature. |
Ctrl+P | Pan to the active explored input location analysis point feature. |
Ctrl+Z | Zoom to the active input location analysis point feature and its located position. |
Ctrl+A | Select the active input location analysis point feature. |
Ctrl+L | Load the select input location analysis features. |
Delete | Clear the explore input location analysis point feature results. |
Ctrl+ click the input location analysis point feature | Change the active input location analysis point feature to the clicked point. |
Up arrow key | Change the active input location analysis point feature to the next row up in the data grid. |
Down arrow key | Change the active input location analysis point feature to the next row down in the data grid. |
Access the Explore Locations tool
The tool is available on the network analysis ribbons when a network analysis layer is selected in the Contents pane.
- Create a network analysis layer.
- Load input data for the current analysis layer.
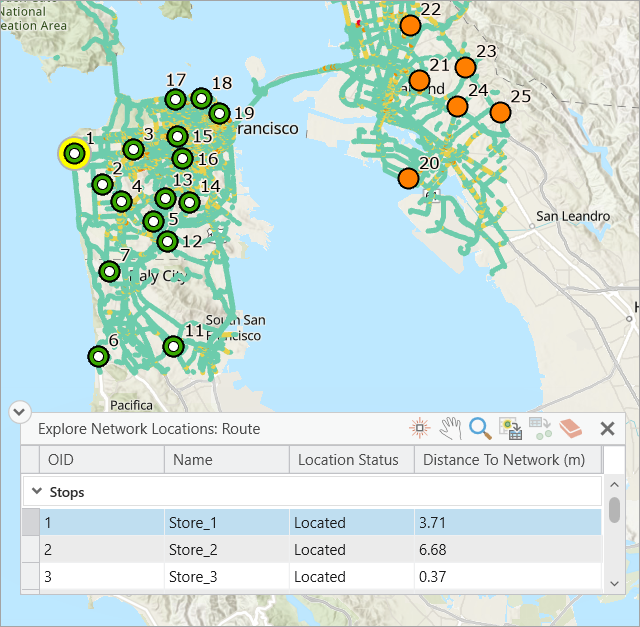
In the below image, stops are imported in the Stops sublayer of the Route analysis layer using the Add Locations tool.

- In the Contents pane, click Route to select the group layer.
The Route Layer tab appears.
- Click the Route Layer > Input Data > Explore Locations tool.
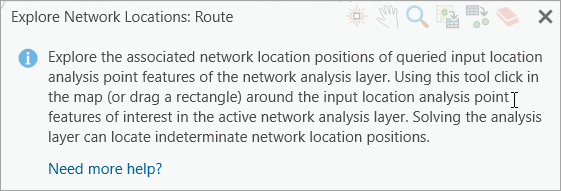
The Explore Network Locations: Route window appears. You can move around the window on the screen for appropriate placement.
Note:
For illustration, the Route layer has been used and therefore the dialog box title has Route. The analysis layer name will be the one you are working on currently.
- Draw a box around a collection of input points.
The selected point features get populated in the Explore Network Locations: Route window and the tools on the upper right corner of this window get enabled.
