| Label | Explanation | Data Type |
Input Reference Radar Data
| The input reference complex radar data. | Raster Dataset; Raster Layer |
Input Secondary Radar Data
| The input secondary complex radar data. | Raster Dataset; Raster Layer |
Output Radar Data
| The output interferogram radar data. | Raster Dataset |
Polarization Bands
(Optional) | The polarization bands that will be interfered. The first band is selected by default. | String |
Remove topographic phase
(Optional) | Specifies whether the topographic phase signal will be removed.
| Boolean |
DEM Raster
(Optional) | The DEM raster that will be used to estimate the phase signal resulting from the terrain. This parameter is required when the Remove topographic phase parameter is checked. | Mosaic Layer; Raster Layer |
Apply geoid correction
(Optional) | Specifies whether the vertical reference system of the input DEM will be transformed to ellipsoidal height. Most elevation datasets are referenced to sea level orthometric height, so a correction is required in these cases to convert to ellipsoidal height.
| Boolean |
Output Flattened Interferogram
(Optional) | The output flattened interferogram radar data. This output only accounts for flat earth correction. | Raster Dataset |
Available with Image Analyst license.
Summary
Creates an interferogram by differencing the phase of the reference and secondary single look complex (SLC) inputs. This is accomplished by cross correlating the complex input radar data pairs.
The tool can also be used to remove the phase contribution from topography using an input digital elevation model (DEM).
The output interferogram will also be in a complex format. A complex interferogram has the following components:
- Phase—Represents the difference in the radar signal's phase between the two SLC images. This phase information is sensitive to surface deformation, topography, and atmospheric effects, making it the core component for interferometric analysis.
- Amplitude—Represents the combined strength of the radar signals from the two SLC images. This amplitude information is the combined strength of the radar signal of two SLC datasets. Areas with high amplitude often correspond to more stable and consistent radar returns, which can be indicative of higher coherence and better data quality.
Usage
This tool creates an interferogram in a complex data format. The interferogram is the core product created in InSAR and DInSAR workflows.
The input must be a pair of complex radar data from the same mission and acquisition mode and direction. The pair must also be from the same orbit track. Sentinel-1A, Sentinel-1B and Sentinel-1A SLCs can be paired since they both correspond to the Sentinel-1 mission.
The input radar pair must be coregistered. Run the Apply Coregistration tool to coregister the input radar data pair before running this tool.
Co-polarized bands are more commonly used than cross-polarized bands to optimize results. Cross-polarized bands are not typically used for InSAR workflows due to their inherent low coherence.
Specify the co-polarized band for the Polarization Bands parameter to improve coherence and optimize downstream processing.
Examples of co-polarized bands include VV and HH.
The output of this tool will be displayed using the Bathymetric Scale color scheme.
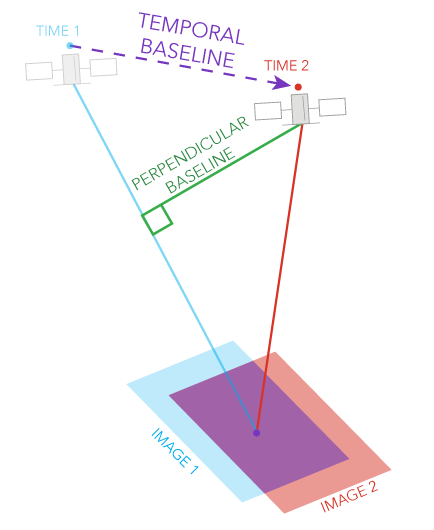
Baseline considerations for InSAR applications are shown in the following table:
Baseline type Definition Smaller baseline Larger baseline Perpendicular baseline
The component of the physical separation between the two satellite acquisition positions that is perpendicular to the line of sight (LOS).
Preserves phase coherence, which is ideal for surface deformation monitoring. Sensitivity to elevation differences is reduced, making it less ideal for DEM generation.
Increases sensitivity to topography, which is ideal for DEM generation.
Temporal baseline
The time separation between the two acquisitions.
Better coherence in dynamic areas and captures rapid changes such as landslides and earthquakes.
Suitable for detecting slow, cumulative deformation such as tectonic motion, although it carries a risk of decorrelation.

When the Remove topographic phase parameter is checked, the tool will remove the topographic phase signal from the output interferogram using a DEM. This is a necessary processing step for DInSAR workflows to isolate the deformation signal.
For optimal results, the input DEM should have a similar resolution to the input radar data.
Parameters
GenerateInterferogram(in_reference_radar_data, in_secondary_radar_data, out_radar_data, {polarization_bands}, {remove_topographic_phase}, {in_dem_raster}, {geoid}, {out_flattened_interferogram})| Name | Explanation | Data Type |
in_reference_radar_data | The input reference complex radar data. | Raster Dataset; Raster Layer |
in_secondary_radar_data | The input secondary complex radar data. | Raster Dataset; Raster Layer |
out_radar_data | The output interferogram radar data. | Raster Dataset |
polarization_bands (Optional) | The polarization bands that will be interfered. The first band is selected by default. | String |
remove_topographic_phase (Optional) | Specifies whether the topographic phase signal will be removed.
| Boolean |
in_dem_raster (Optional) | The DEM raster that will be used to estimate the phase signal resulting from the terrain. This parameter is required when the remove_topographic_phase parameter value is TOPO. | Mosaic Layer; Raster Layer |
geoid (Optional) | Specifies whether the vertical reference system of the input DEM will be transformed to ellipsoidal height. Most elevation datasets are referenced to sea level orthometric height, so a correction is required in these cases to convert to ellipsoidal height.
| Boolean |
out_flattened_interferogram (Optional) | The output flattened interferogram radar data. This output only accounts for flat earth correction. | Raster Dataset |
Code sample
This example generates an output interferogram.
import arcpy
arcpy.env.workspace = r"C:\Data\SAR"

outRadar = arcpy.ia.GenerateInterferogram("Reference.crf",
    "Secondary_Coreg.crf", "VV", "TOPO", "dem.tif", "GEOID",
    "flattened_IFG.crf")
outRadar.save(out_radar_data}This example generates an output interferogram.
# Import system modules and check out ArcGIS Image Analyst extension license
import arcpy
arcpy.CheckOutExtension("ImageAnalyst")
from arcpy.ia import *

# Set local variables
in_ref=r"C:/Data/SAR/Reference.crf"
in_second=r"C:/Data/SAR/Secondary_Coreg.crf"
polarization="VV"
in_DEM=r"C:/Data/SAR/DEM.tif"
out_flat_ifg=r"C:/Data/SAR/flat_IFG.crf"

#Create output
outRadar = arcpy.ia.GenerateInterferogram (in_ref, in_second,
    polarization, "TOPO", in_DEM, "GEOID", out_flat_ifg)
outRadar.save(out_radar)
Environments
Licensing information
- Basic: Requires Image Analyst
- Standard: Requires Image Analyst
- Advanced: Requires Image Analyst