A small section of San Francisco needs to replan the residential waste collection pickup for their Monday routes. They have three small dual-compartment trucks that can pick up 450 bins in the waste compartment and 325 in the recycling compartment. The waste collection solver is intended to create routes for garbage trucks dividing up the residential locations from a single district on a single day.
In this tutorial, you will use the waste collection solver to optimize the Monday garbage truck routes for this district of San Francisco. You will learn how to configure a waste collection analysis layer, adjust the outputs according to local knowledge, and generate a route report.
Note:
The data used in this tutorial is fictitious and has been created solely to solve the example scenario stated above.Get the data
The data for this tutorial is available for download.
- Go to the data download page.
- Click the Download button, and save the file locally.
- Unzip the downloaded file.
Create a map
To create a map, complete the following steps:
- Start ArcGIS Pro.
- Click the Map template to create a project. Optionally, change the name of the project and location.
- Click OK.
A new project with a map appears.
Add the tutorial data to the project
A network dataset is an intelligent model of the road system. It contains not only the location and attributes of roads but also information about how roads relate to one another, such as which roads are connected, which turns between connected roads are allowed or prohibited, and other information that affects what travel paths are possible and how long travel takes.
Note:
The waste collection solver is only able to use a local network dataset within ArcGIS Pro or its ArcPy functionality. It is currently unavailable in ArcGIS Online or ArcGIS Enterprise.To add a network dataset to the map, complete the following steps:
- In the Catalog pane, which is on the right side of the application by default, right-click Folders, and choose Add Folder Connection
 .
.The Add Folder Connection dialog box appears.
- Browse to the folder where you placed the tutorial data, double-click Network Analyst, and click Tutorial to select the folder.
- Click OK.
A connection to the Tutorial folder is created.
- In the Catalog pane, expand Folders > Tutorial > SanFrancisco.gdb > Transportation.
- Drag Streets_ND, which has the network dataset icon
 , onto the map.
 The network dataset is added to the Contents pane and to the map.
- In the Contents pane, uncheck Streets_ND to display only the basemap.
Next, add the network dataset contained in the folder to the map.
Add the Houses feature class
The resident locations that need to be collected for Monday have already been converted into a feature class with information about how many waste collection bins, recycling bins, and yard waste bins each house has. You can use geocoding to create a feature class from your own address data.
- In the Catalog pane, expand Folders > Tutorial > SanFrancisco.gdb > Analysis.
- Drag the Houses feature class onto the map.
The feature class is added to the Contents pane as well as to the map.
- In the Contents pane, right-click the Houses feature class and select Zoom To Layer.
Create the waste collection analysis layer
The waste collection solver is a specialized version of the vehicle routing problem solver that focuses on optimizing the collection of household waste from residential locations in a single district on a single day using garbage trucks dispatched from a single starting depot. A waste collection analysis layer allows you to configure the inputs and settings for the analysis and to view the analysis results. You can add information about the customers, vehicles, drivers, and starting and ending locations for the routes as well as renewal locations to empty the garbage truck. Using the Waste Collection tab associated with the layer, you can configure analysis settings, such as the start time and units of measurement. After solving the analysis, you can access the outputs and generate reports.
To create the waste collection analysis layer, complete the following steps:
- On the Analysis tab, in the Workflows group, click Network Analysis > Waste Collection.
The Waste Collection analysis layer is added to the Contents pane. It includes several sublayers that contain the inputs and outputs of the analysis.
This layer is referencing the San Francisco network dataset because the network was in the Contents pane when the Waste Collection layer was created.
Note:
To review or change the network data source that is used to create the network analysis layer, on the Analysis tab, in the Workflows group, click the Network Analysis drop-down menu and view Network Data Source. If the Network Data Source is referencing ArcGIS Online or ArcGIS Enterprise, the Waste Collection layer will be grayed out.
Add stops
Stops are used to specify information about the customers. Information can be specified about each stop, such as the amount of time the driver is expected to be at that location and the quantity of waste to be collected for up to two fractions (for example, landfill waste and recycling).
To add stops, complete the following steps:
- Select the Waste Collection layer in the Contents pane to enable the tab.
- Click the Waste Collection Layer tab, and in the Input Data group, click the Import Stops
 button.
 The Add Locations dialog box appears.
- Select Houses for Input Locations.
- Under Field Mappings, select Name from the Property section.
- From the Field Name drop-down list, select ID.
Since every house has a unique ID, the ID is mapped to the Name field on the Stops sublayer.
- Under Field Mappings, select Bins_1 and in the Field Name drop-down list, select WasteBins.
- Under Field Mappings, select Bins_2 and in the Field Name drop-down list, select RecycleBins.
In this case, the quantity of each fraction using the number of bins the household has is being tracked. However, it could have been tracked by an estimate of weight or volumes instead.
- Click OK.
Houses are added to the Stops sublayer.

- In the Contents pane, right-click the Stops sublayer, and select Attribute Table.
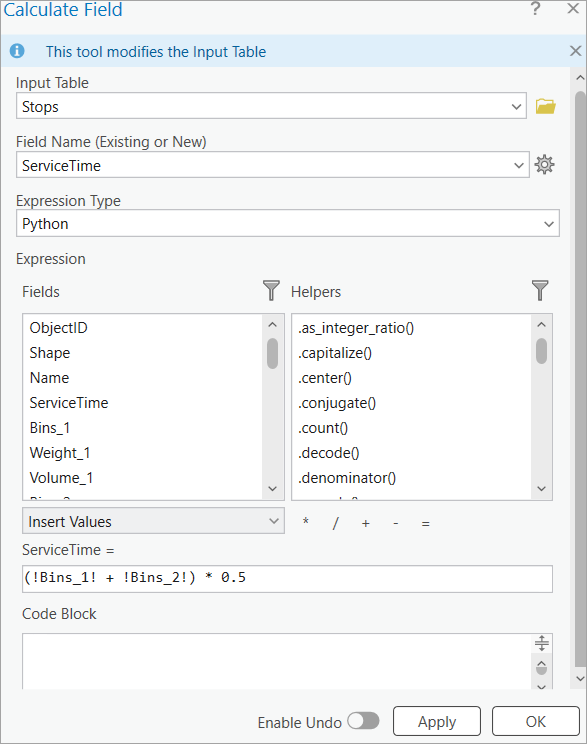
- In the attribute table, right-click the ServiceTime field, and select Calculate Field.
The Calculate Field dialog box appears.
- Set the ServiceTime value to (!Bins_1! + !Bins_2!) * 0.5.
- Click OK.
The ServiceTime field is now populated with an appropriate value.
- Close the attribute table.
Add the garage location to the Depots sublayer
Depots are where the routes start and end their day. All routes must start and end at the same location. For this analysis, the garage will be used as the depot. The garage's address can be geocoded using the Locate pane.
Note:
Using the Add To Feature Class option with ArcGIS World Geocoding Service consumes credits. Using the provided locator does not consume credits.
To add the garage location, complete the following steps:
- In the Catalog pane, browse to the location of the tutorial data, right-click SanFranciscoLocator.loc, and click Add To Project.
- Click the Map tab, and in the Inquiry group, click the Locate button
 .
. 
The Locate pane appears.
- Click the Options drop-down arrow next to the search box.
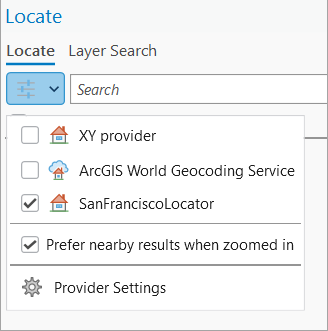
- Uncheck all available locators, except SanFranciscoLocator.
- In the search text box, enter the garage shop’s address, 2159 Chestnut St, San Francisco, CA, 94123, and press Enter.
- In the Locate pane, right-click option A, and select Add To Feature Class.
The Add To Feature Class window appears, where you can select the feature class to add the address.
- Expand Waste Collection: Depots, select the Depots template, and click OK.
- In the Contents pane, right-click the Depots sublayer, and select Attribute Table.
A row has been added to the attribute table representing the only location of the garage. The full address of the garage was included as the depot's name.
- Close the attribute table.
- On the Edit tab, do the following: clear the selection and save the edits.
- In the Selection group, click Clear
 to clear the selected feature.
 - In the Manage Edits group, click Save
 to save the edits.
- In the Selection group, click Clear
- Close the Locate pane.
Add information to the Routes sublayer
Routes include information about both the vehicle and the driver. Information can be included about a driver's workday, such as when they start and how long they can work in a day. Vehicle information can also be included, such as capacity.
If this information is already in a table or feature class, the Add Locations option used for Stops can be used to load that information into the layer. However, if you just have knowledge of the business constraints, those can be added to the Add Fleet Routing Routes geoprocessing tool to add it into table form. In this case, three routes can be used and that they start and end at the garage location. You will also include that each vehicle can collect 450 bins in compartment 1 and 325 in compartment 2 for the waste and recycling bins, respectively.
Routes capture information about the vehicle and driver. The MaxBins_1, MaxWeight_1, MaxVolume_1, MaxBins_2, MaxWeight_2, and MaxVolume_2 fields are constraints on the vehicle. They indicate the maximum amount of waste the vehicle can hold before needing to visit a landfill or transfer station to empty the vehicle. If there is still time in the driver's workday, the vehicle is then able to collect more waste. The fields MaxTotalTime and MaxTotalDistancerefer to a constraint for the entire duration of the route. The route will not go beyond the time or distances indicated here for the full workday.
Note:
It is important to add the depot information first so that the name of the depot can be used for the Routes sublayer. The StartDepotName and EndDepotName will need to match the Name field of the depot exactly.
To add routes and other information to the Routes sublayer, complete the following steps:
- In the Contents pane, right-click the Waste Collection group layer name, and select Zoom to Layer to zoom out to the full extent.
- Return to the Waste Collection Layer tab.
- In the Input Data group, click the Import Routes drop-down list, and select Add Routes.
The Add Fleet Routing Routes dialog box appears.
- Set the following values:
- Number of Routes—3
There are three garbage trucks available so that is the maximum number of routes they can send.
- Start Depot Name—2159 Chestnut St, San Francisco, CA, 94123
The route must start and end at the garage, so both the Start Depot Name and End Depot Name values are the address of the garage.
You can select Start Depot Name from the drop-down list and the value must match the value in the Name field of the Depots sublayer.
- End Depot Name—2159 Chestnut St, San Francisco, CA, 94123
You can select End Depot Name from the drop-down list and the value must match the value in the Name field of the Depots sublayer.
- MaxBins_1—450
Each vehicle can hold a maximum of 450 bins for compartment 1. It is important for the fraction used for MaxBins_1 match the fraction used for Bins_1, which in this case is the number of waste bins.
- MaxBins_2—325
Each vehicle can hold a maximum of 325 bins for compartment 2. It is important for the fraction used for MaxBins_2 match the fraction used for Bins_2, which in this case is the number of recycle bins.
- Number of Routes—3
- Click OK to run the tool.
Three routes are added to the Routes sublayer.
Adjust the travel mode
For waste collection, it is important to adjust the travel mode to fit the capabilities of the trucks and the driving policies. Often these trucks have fewer driving restrictions than an average person driving a vehicle such as being able to drive through gates or on private roads. In this case, the network only has two restrictions: one-way streets and turn restrictions. You will keep both of these restrictions but will adjust the U-turn policy. The trucks in this area are allowed to only make a U-turn at a dead-end street.
- On the Waste Collection Layer ribbon, in the Travel Settings section, click the launcher button
 in the lower right.
This opens the layer property pages where Travel Mode is the active tab.
- Expand the U-turns section.
- Select Dead Ends from the drop-down list and click OK.
This adjusts the travel mode on the ribbon to <Driving Time>. The brackets indicate that it is a custom travel mode. Travel modes could also be set up on the network dataset itself to allow for a standard travel mode to be used for the analysis.
Set the analysis parameters and run the analysis
You will now set the start time and max total time for the routes and the collection mode for the stops. These three values could be set for each route and each stop, respectively, but since they are homogeneous for this analysis it is easy to set them on the layer ribbon as default parameters.
- On the Waste Collection Layer ribbon, in the Time section, set the default time of day to 6:00 AM.
- Also in the Time section, set the Max Total Time to 360.The Time Units for the layer are still set to the default value of Minutes. So this sets the maximum work day to 360 minutes, or six hours.
- In the Advanced section, set the Collection Mode drop-down menu to One Side at a Time.This indicates that the route will collect everything on one side of the street for a block at once and will then return to the block at a different time to collect everything on the other side of the street. This is true even for one-way streets, except for instead of traveling in each direction down the street, for a one-way street it would continue to follow the required flow of traffic but would indicate which curb the collection should be made for the collection, and the two sides of the street would be collected separately.
- In the Analysis group, click Run.The Waste Collection solves. The Stops are assigned to routes, and the symbology updates to creating the route lines and showing assigned stops following the default color scale.

Examine one-way streets
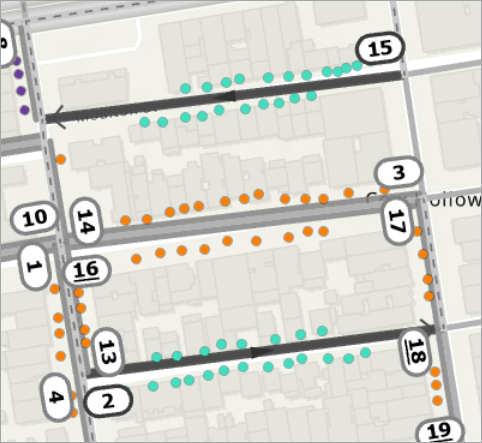
There are two blocks that are one-way streets. With the current setup, these blocks are to be traversed twice, collecting each curbside separately. In some situations, it would instead make sense to collect both curbs at the same time, going down the street just a single time. To do this, you will use the Stops CollectionMode attribute field to indicate that for just these blocks you want to collect both sides together.
Learn more about network dataset symbology
- If the Streets_ND network dataset layer is not in the Contents pane, add it again.
- Check the layer to make it visible.
- Right-click Streets_ND and select Symbology.
- Select the Symbolize edge lines of your network dataset layer option.
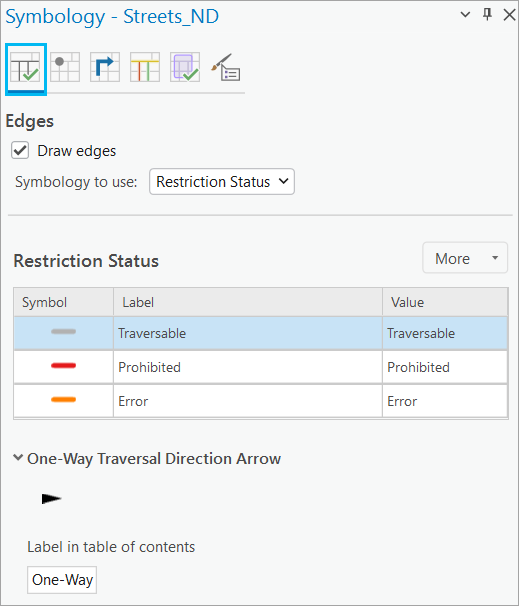
- Check Draw edges and from the Symbology to use drop-down menu, select Restriction Status.
- Switch to the Symbolize traffic lines of your network dataset layer option.
- Uncheck Draw traffic.
- Select all of the stops on both of these two street edges by following the steps below:
- Select a stop on one of the street edge and take a note of the SourceOID.
- Repeat the same for the other edge.
- Open the attribute table for the Stops sublayer and click Select By Attributes
 .
.The Select By Attributes dialog box appears.
- Set a query based on the SourceOID of the two streets noted above such that the stops on both sides of these streets get selected.
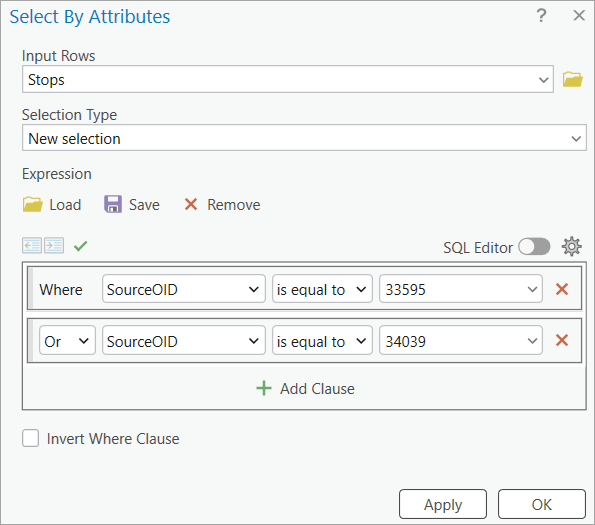
Stops on both one-way streets get selected.
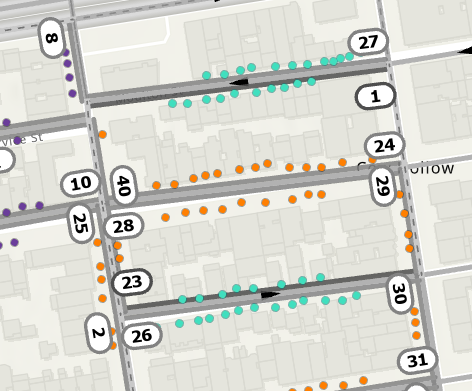
- Right-click the CollectionMode field and select Calculate Field.
- From the Expression Type drop-down menu, select Arcade and set the following query : DomainCode($feature, 'CollectionMode', 'Both sides')
This is a coded value domain for Both sides. Make sure it is using the selection so only the stops on these two edges are given a collection mode of both sides. These stops will be collected with both sides together, with the remainder of the stops having the null value in the attribute table using the default Stop Collection Mode set to One Side at a Time. You can check the domain value by opening the attribute table for the Stops sublayer and double-clicking a field row for the CollectionMode.
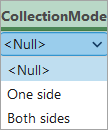
- In the Analysis group, click Run to rerun the analysis. Examine how the collection of these streets change.
- In the Contents pane, uncheck the Streets_ND network dataset layer.
Add a renewal site to the model
For waste collection, it is common to allow the garbage truck to go to a landfill or transfer station and empty the vehicle before continuing the route. This is modeled as Renewals and Route Renewals.
Add the transfer station to the Renewals sublayer.
- Click the Map tab, and in the Inquiry group, click the Locate button
 .
. 
The Locate pane appears.
- In the search text box, enter the transfer station address, ALANA WAY, BRISBANE, CA, 94005, and press Enter.
- In the Locate pane, right-click option A, and select Add To Feature Class.
The Add To Feature Class window appears, where you can select the feature class to add the address.
- Expand Waste Collection: Renewals, select the Renewals template, and click OK.
- In the Contents pane, right-click the Renewals sublayer, and select Attribute Table.
A row has been added to the attribute table representing the only location of the transfer station. The full address of the transfer station was included as the renewal's name.
- Change the renewal's Name field to TransferStation.
- Close the attribute table.
- On the Edit tab, clear the selection and save the edits.
- Close the Locate pane.
- On the Waste Collection Layer ribbon, in the Input Data section, select the Import Renewal drop-down menu and select Import Route Renewals.
The Add Locations dialog box appears.
- For Input locations, select Waste Collection\Routes.
- For Field mappings, do the following:
- Map the RouteName to Name
- For RenewalName, set a Default Value of TransferStation. The spelling and capitalization of this needs to match exactly the Name field in the Renewals sublayer.
- For ServiceTime, set a Default value of 20 to indicate that it takes 20 minutes to offload the truck.
- Click OK.
Decrease the Route capacity to require renewals and solve
Although this would not be done in a normal situation, it is done here just to show the use of renewals.
- In the Contents pane, right-click the Routes sublayer, and select Attribute Table.
- In the attribute table, right-click the MaxBins_1 field, and select Calculate Field.
The Calculate Field dialog box appears.
- Set MaxBins_1 = 225.
- Click OK.
The MaxBins_1 field is updated to 225 for all three routes.
- Close the attribute table.
- On the Waste Collection Layer tab, in the Time section, set Max Total Time to 480 to account for additional time to drive to and from the transfer station.
- In the Analysis group, click Run.
The Waste Collection solves. Right-click the Stops sublayer and select Zoom To Layer. The stops are assigned to routes, and the symbology updates to creating the route lines and showing assigned stops following the default color scale.
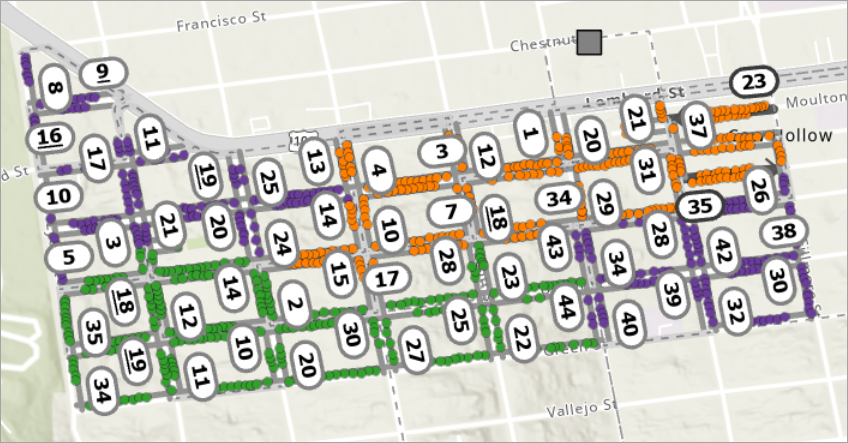
- In the Reports section of the Waste Collection Layer ribbon, click the Route Report button.

- The Export Report To PDF geoprocessing tool opens.
- Run the tool to generate the .pdf file of the report.
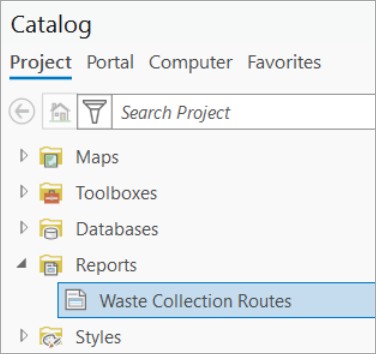
In the Catalog pane, in the Reports section, the copied report file can be found. To customize the report file, you can open the report from here and have the full capabilities of reports. Or select a location on your machine to save the file and run the geoprocessing tool to see the report .pdf file.
