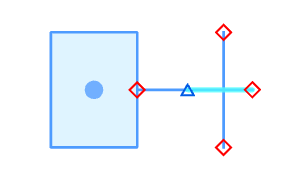
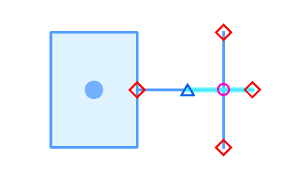
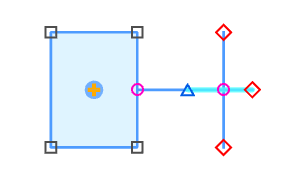
The Vertices and Nodes settings customize the vertices and nodes graphic overlay. You can choose the layer and feature types for which symbols are displayed and change scale, tolerance, and symbology settings. These settings are configured on the Editor Settings dialog box.
For steps to enable Vertices and Nodes in a map, see Symbolize vertices and nodes.
Choose the layer type and feature mode
The layer setting determines the type of layer for which symbols are displayed, while the feature mode defines the feature types where dangle, node, and pseudonode symbols are shown.
To change the layer and feature mode settings, complete the following steps:
- On the Edit ribbon tab, click Settings
 in the Manage Edits group.
Alternatively, hover over the Vertices and Nodes button
 on the status bar at the bottom of the active map and click Vertices and Nodes Settings
  .
.
The Editor Settings dialog box appears.
- Click the Vertices and Nodes side tab and expand the General section.
- Click the Layers drop-down arrow and choose the layer type for which symbols are displayed.
You can render vertices and nodes on editable, visible, or snappable layers.

- Choose a feature mode:
Refer to the symbology section below for details on how each symbol type represents specific feature connections.
Line Endpoints
Show dangle, node, and pseudonodes only for line feature endpoints.

Lines
Show dangle, node, and pseudonodes only for line feature endpoints and line feature edge intersections.

Points, Multipoints, Lines and Polygons
Show dangle, node, and pseudonodes for point, multipoint, line, and polygon features.

Tip:
Verify that the Symbology settings also have dangle, node, and pseudonode symbols enabled.
- To reset all settings to their default values, click Reset Page at the bottom of the dialog box and click Yes.
- Click OK.
Change scale settings
The scale setting adjusts the size of the symbols based on the current view scale or the reference scale assigned to the map. You can also define the minimum scale at which the symbols remain visible when zoomed out.
To change the scale settings, complete the following steps:
- On the Edit ribbon tab, click Settings
 in the Manage Edits group.
The Editor Settings dialog box appears.
- Click the Vertices and Nodes side tab and expand the General section.
- Check or uncheck the Scale symbols when a reference scale is set check box.
Checked
Size symbols using the map reference scale.
Unchecked
Size symbols to the current map view scale and ignore the map reference scale setting.
- Click the Do not show out beyond drop-down arrow and choose the minimum scale at which the symbols remain visible when zoomed out.
- To reset all settings to their default values, click Reset Page at the bottom of the dialog box and click Yes.
- Click OK.
Change the dangle tolerance
The dangle tolerance defines the maximum distance within which dangles are searched for and displayed relative to other features. If set to zero (0), no search for dangles occurs, and all unconnected line feature endpoints are symbolized as dangles.
Note:
Setting the dangle tolerance to a nonzero value may impact performance, with results varying based on the size and complexity of the data.
To change the dangle tolerance, complete the following steps:
- On the Edit ribbon tab, click Settings
 in the Manage Edits group.
The Editor Settings dialog box appears.
- Click the Vertices and Nodes side tab and expand the General section.
- Type a distance in the Dangle Tolerance box, and choose a unit format.
- To reset all settings to their default values, click Reset Page at the bottom of the dialog box and click Yes.
- Click OK.
Configure symbology
The symbology options allow you to choose what is symbolized when Vertices and Nodes is enabled on the status bar at the bottom of the active map.
To configure symbology, complete the following steps:
- On the Edit ribbon tab, click Settings
 in the Manage Edits group.
The Editor Settings dialog box appears.
- Click the Vertices and Nodes side tab and expand Symbology.

- Check or uncheck the Dangles, Nodes, and Pseudonodes check boxes.
The nodal symbols identify the spatial relationships between features, allowing you to visually determine how they connect.
Tip:
Verify that the feature mode setting properly displays these symbols for the intended feature types.
Dangles
A dangle symbol appears when the endpoint of a line feature does not connect, within the dangle tolerance, to a point feature or the edge of a line or polygon feature. Dangles are often referred to as undershoots or overshoots.
Note:
- If the dangle tolerance is set to zero (0), dangles are shown for all unconnected line feature endpoints.
- If a dangle falls outside the dangle tolerance and Vertices are enabled, a vertex symbol is shown.
Nodes
A node symbol appears where two or more edges meet or intersect, and where three or more endpoints of different line features connect. Nodes at edge intersections imply a topological connection between the edges.
Pseudonodes
A pseudonode symbol appears where the endpoints of two different line features meet. Pseudonodes are typically used to highlight locations where two features can be merged.
- Check or uncheck Vertices, Isolated Points, Background, and the edge symbol check boxes.
The following symbols identify specific feature geometry, allowing you to distinguish them from the nodal elements.
Vertices
A vertex symbol appears at each vertex of a line or polygon feature that isn’t a nodal element. It also appears where a point feature connects to the edge of a line or polygon.
Isolated Points
An isolated point symbol appears for a point feature that isn't connected to any other features.
Background
The background is drawn between the vertices and node symbols and the visible feature layers within the view's extent. It provides color contrast to enhance symbol visibility and improve readability.
Straight Edges
The Straight Edges symbol highlights straight segments of a line or polygon feature.
Note:
If Curved Edges or Bezier Curved Edges are unchecked, segments that are true curves for those settings are also highlighted using this symbol.
Curved Edges
The Curved Edges symbol highlights circular features and circular arc segments of a line or polygon feature.
Bezier Curved Edges
The Bezier Curved Edges symbol highlights Bezier curve segments of a line or a polygon feature.
- To customize the color or other formatting for a symbol, click the symbol name and adjust the controls that appear below the symbol check boxes.

Note:
Formatting options vary depending on the selected symbol.
- To restore the default symbology settings, click Reset to default
 .
. - To reset all settings to their default values, click Reset Page at the bottom of the dialog box and click Yes.
- Click OK.