Available with Spatial Analyst license.
Obtaining accurate stream data and understanding how water moves through a landscape is vital to flood plain delineation and water resource management. Commonly, this is done through deriving hydrologic information from digital elevation models (DEMs). However, DEMs are generally created from remote sensing data which does not capture elements of the physical landscape that cannot be seen from overhead or above. Stormwater infrastructure such as culverts and other underground infrastructure are not included in this data. If only a DEM is analyzed, the lack of information about below-surface channels can manifest in the analysis as disruptions in water that does not reflect real-world behavior. Finding these areas of disrupted flow can allow for better conditioning of DEMs.
The Locate Depressions tool locates areas that are topographically lower than the surrounding terrain which can potentially disrupt water flow. This tool can filter these areas based on spatial characteristics. The outputs from the tool also contain information that can be used for further filtering.
This tool uses a DEM surface as input and creates polygons that define these areas. These areas, also known as depressions, are topographically lower than their surroundings. The tool also optionally creates points associated with each depression that could be used for additional filtering.
How depressions are found
Depressions are found by comparing the original DEM with a filled version of the DEM. The Fill tool is used internally to create the filled version of the DEM. Then, the original DEM is subtracted from the filled version. Cells that change value when the DEM is filled are depression cells. When subtracting the filled DEM from the original, these cells produce values greater than 0.

To learn more about filling sinks and depressions, see How Fill works.
Once all possible depressions are found, their edges are smoothed using the Boundary Clean tool. Then depressions are filtered based on the optional analysis parameter values. There are two conceptual groups of optional analysis parameters: depression geometry and how depressions are related to the environment around them. How depressions are related to the environment around them includes proximity to a downstream connection point and to roads.
Once depressions are filtered, the final output is returned. The filtering process and the outputs of the tool will be discussed in further detail below.
Filtering by depression geometry
There are two parameters that control the dimensions of depressions. Depressions that have a maximum depth less than the Minimum Depth value will be excluded. Depressions with an area less than the Minimum Area parameter value will also be filtered out. Only depressions with a maximum depth and an area greater than these values will be included in the output.
The area being considered here is the surface area of the top of the depression—in other words, the land area a depression takes up or the area of a lake from a bird's-eye view.
The Z Unit parameter value ensures proper computation of depth and application of the Minimum Depth parameter. When necessary, the Minimum Depth parameter value is converted to units of the Z Unit parameter.
Filtering by downstream connections
How depressions are related to the environment around them can also provide useful information. Culverts are generally relatively short and located near roads. Through the remaining optional analysis parameters, distances can be specified to constrain how far depressions are from a downstream connection and a road.
A downstream connection is defined as the closest cell to the edge of a depression that has an elevation lower than the lowest elevation cell within the depression. Depressions with a downstream connection that is farther away than the Maximum Distance to Connection parameter value will be filtered out. The distance is measured from the cell center of a depression edge cell to the cell center of the first found, closest cell with an appropriate elevation value.
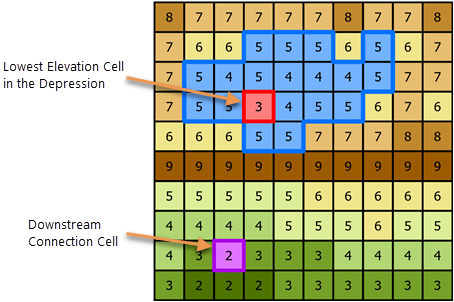
Figure 2 below shows the lowest elevation cell in the example depression found in Figure 1. The elevation value of the lowest elevation cell is 3, so the downstream connection cell must have an elevation of less than 3. The nearest cell with an elevation lower than 3 is the cell with an elevation value of 2. This cell represents the downstream connection location.

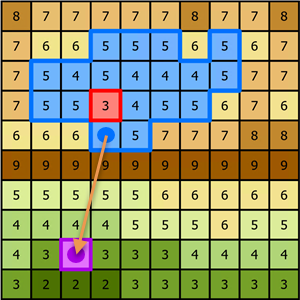
The distance between the cells highlighted in Figure 2 is measured from the cell center of the closest cell on the edge of the depression to the cell center of the downstream connection. Figure 3 shows an illustration of this distance—in this example, the distance equal to the square root of 17 or about 4.12 cell widths. So, if the Maximum Distance to Connection parameter value was less than 4.12 cells, the depression would not be included in the output.

Filtering by proximity to roads
In addition to the downstream connection, depressions can also be filtered by their proximity to roads. Culverts are used to route water underneath roads, so they are generally located in close proximity to them.
When road data is available, it can be provided in the Input Raster or Feature Roads parameter. If the road data is provided as a feature layer, the tool converts it to raster format using the cell size of the Input Surface Raster. If the road data is provided as a raster with a cell size different than the elevation raster, it is rescaled to match the Input Surface Raster.
The Maximum Distance to Roads parameter can only be applied when road data has been specified. Depressions that are farther away from a road than the Maximum Distance to Roads parameter will be filtered out.
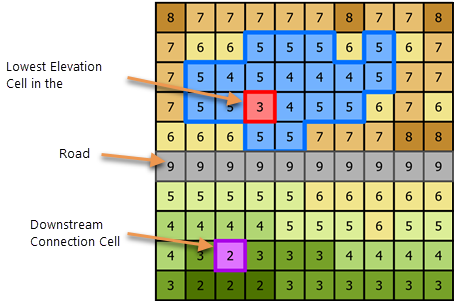
In the depression example from previous figures, a road is located right below the depression. Figure 4 shows the road. The distance from a depression to a road is measured from the cell center of a depression edge cell to the cell center of the road. The resulting distance for this example is 1 cell.

Output depressions and connection points
Only depressions that meet all criteria set by the optional analysis parameters will be part of the Output Depressions Polygons parameter value. These polygons contain fields with additional information you can use for further filtering. The type of information available in these fields includes the area and volume of the depressions, the distance to the closest depression, the distance to the downstream connection point, and if applicable, the distance to the closest road. Fields that contain distance values are in meters and calculated from cell centers.
An additional optional parameter, Output Connection Points, is available. This output contains the lowest elevation point in each depression and the corresponding downstream connection point for all output depressions. The POINT_TYPE field contains either a 0 if that location is the lowest elevation value in the depression, or a 1 if it is the downstream connection point for a depression. The DEP_ID field contains the identifier of the depression the points are associated with. These points also contain additional fields with information that may be helpful for further filtering of depressions. Fields that contain distance values are in meters and calculated from cell centers.