Available with Spatial Analyst license.
The Value Percentile Contours tool generates polygons that enclose the top (or bottom) p percent of the map by raster value. Instead of picking a fixed value first, the tool finds the percentile threshold such that at least the defined percentile of valid cells is at or beyond that value. Each output polygon at percentile p is the area where values are at or beyond the pth percentile. With multiple percentiles, output polygons are nested. The innermost (minimum) polygon corresponds to the highest values, while the outermost (maximum) polygon covers a broader slice. The polygon's shape area reports how much ground falls in that extreme band.
When to use
Use the Value Percentile Contours tool when the question is about extent, such as the location of the highest values occupying p percent of the area. Some examples include the following:
- Find the top 10 percent hottest land-surface temperatures
- Find the bottom 20 percent of areas with access to health-care facilities
- Find the top 5 percent crime intensity footprint
- Find the top 1 percent noise hotspots
To find the amount of area that holds p percent of total value × area (for example: 50 percent of total incidents), it is recommended that you use the Volume Percentile Contours tool.
Comparison with other contour tools
The Contour and Contour List tools create isolines at numeric intervals you specify. These tools are particularly useful when the exact values you want to extract are known.
Compared to these tools, the Value Percentile Contours tool creates polygon contours based on the rank of the raster values.
| Characteristic | Contour tool | Contour List tool | Value Percentile Contours tool | Volume Percentile Contours tool |
|---|---|---|---|---|
What you specify: | Fixed interval or base (regular spacing) | Fixed list of values (irregular spacing) | One or more percentile values | One or more percentile values |
Output: | Polygon or Polyline output | Polyline output | Encloses p% of cells | Encloses p% of total volume |
Percentile consideration: | No | No | Yes | Yes |
Magnitude (volume) consideration: | No | No | No | Yes |
Output geometry: | Polylines and polygons | Polylines | Polygons | Polygons |
Multivalue as input: | Yes (many lines using an interval) | Yes (many lines using a list) | Yes (multipercentile input) | Yes (multipercentile input) |
Regular or irregular spacing: | Regular (interval) | Irregular (explicit list) | Irregular | Irregular |
Nested (overlap) behavior: | N/A | N/A | Nested polygons | Nested polygons |
Area units reported: | Same as raster | Not applicable | Planar map unit2 or geodesic m2 | Planar map unit2 or geodesic m2 |
Primary question answered: | Show the isolines at these values at this interval | Show the isolines at these specified values | Where is the top p% of the area by values | Where is p% of the total magnitude concentrated |
Key concepts
The core concept of this tool is to calculate the percentile from the values (threshold) and display the corresponding portion of the data as an output polygon layer. Imagine lining up all valid cells from lowest to highest. Walk down the line until you have counted p percent of the cells; the value sitting at that position is the percentile threshold. The output polygon will contain anything beyond that threshold to show the extreme values.
In percentile calculation, negative values are used since the percentile calculation is rank-based. However, you can remove the negative values from percentile calculation using the Ignore Negative Values parameter.
An input surface raster may have more than one cell with identical values. In such instances, there is not a single cell that cleanly covers p percent. The tool includes all cells that are at that value. Since the tool takes the entire tied band at the threshold, the output contour polygon may be slightly larger than the p percent. Also, if two percentile values fall on the same value, they produce the same threshold and therefore same output contour polygon.
Workflow examples
Examples follow that demonstrate how the output value is derived for different scenarios.
Input with only positive values
This example shows how the output value is determined when the input is all positive values.
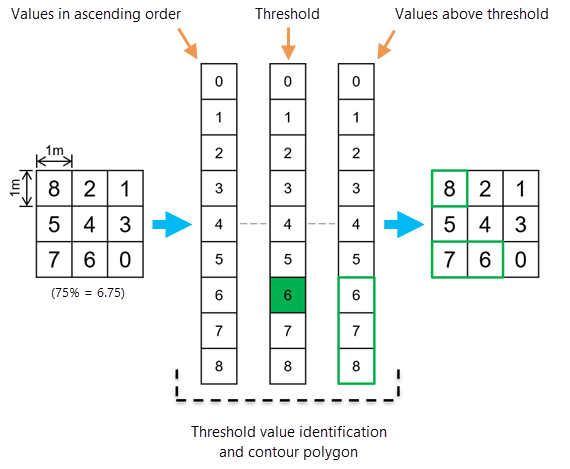
Assume a raster with 9 cells, and each cell has a cell area of Ai = 1. The following are the raster values:
Row 1: |
8 | 2 | 1 |
Row 2: | 5 | 4 | 3 |
Row 3: | 7 | 6 | 0 |
The value list is: {8, 2, 1, 5, 4, 3, 7, 6, 0}.
After sorting the values in ascending order, the list becomes: {0, 1, 2, 3, 4, 5, 6, 7, 8}.
To calculate the 75th percentile value from this value list, the threshold value will be:
p75 = 75 / 100 * 9 = 6.75
Rounding this value to the nearest integer results in the value 7. The 7th value in the ranked list is 6. Consequently, any values that are 6 or above will be included in the output value percentile contour polygon.

Input with both positive and negative values
Consider another scenario in which all the values in a raster surface are unique but not all of the values are positive.
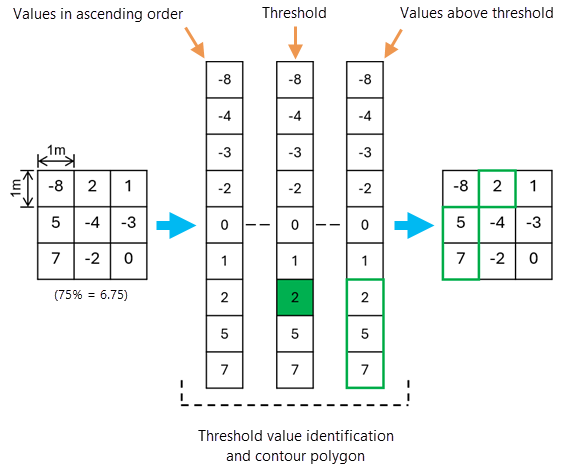
Assume the raster has 9 cells with both positive and negative values. The following are the raster values:
Row 1: |
-8 | 2 | 1 |
Row 2: | 5 | -4 | 3 |
Row 3: | 7 | -2 | 0 |
After sorting the values into ascending order, the list becomes: {-8, -4, -3, -2, 0, 1, 2, 5, 7}
In this case, the 7th value in the ranked list is 2. Therefore, any values of 2 or above will be included in the output value percentile contour polygon.

Input with repeated values
Consider another scenario in which more than one cell has the same value. In this case, all the repeated values are selected.
Assume the raster has 9 cells and the following are the raster values:
Row 1: |
8 | 3 | 1 |
Row 2: | 5 | 5 | 6 |
Row 3: | 7 | 6 | 4 |
After sorting the values into ascending order, the list becomes: {1, 3, 4, 5, 5, 6, 6, 7, 8}.
In this case, the 7th value in the ranked list is 6. However, 6 is a repeated value and is also the 6th value on the list. The tool will select both instances. As a result, the output polygon will have a larger footprint but will still report the correct percentage.

Potential applications
Some potential applications for this tool include the following:
- Find the 90th percentile or higher temperature values from a land surface temperature raster to identify very hot cells without picking up an arbitrary classification.
- Report the 90th or 95th percentile density values from a crime intensity raster to derive consistent hotspots across precincts, then allocate patrol resources accordingly.
- Use an air quality indicators raster to set health-alert classes at empirical percentiles, such as the 90 to 95th percentile, rather than fixed global standards for doing local rankings.
- Compute the 80th percentile travel time from a transit travel time surface. Anything above that can be flagged as being long or inequitable access.
Additional resources
For more information, see:
Hyndman, R. J., & Fan, Y. (1996). "Sample Quantiles in Statistical Packages." The American Statistician, 50(4), 361–365. https://doi.org/10.1080/00031305.1996.10473566.