Available with Spatial Analyst license.
Incoming solar radiation (insolation) originates from the sun; is modified as it travels through the atmosphere; is further modified by topography and surface features; and is intercepted at the earth's surface as direct, diffuse, and reflected components. Direct radiation is intercepted unimpeded in a direct line from the sun. Diffuse radiation is scattered by atmospheric constituents, such as clouds and dust. Reflected radiation is reflected from surface features. The sum of the direct, diffuse, and reflected radiation is called total or global solar radiation.
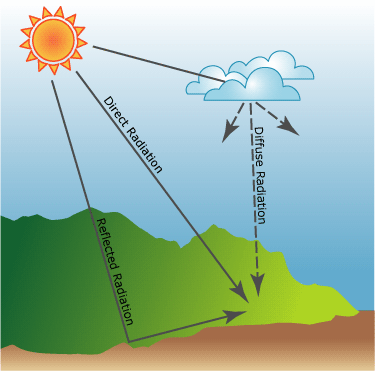
Generally, direct radiation is the largest component of total radiation, and diffuse radiation is the second largest component. Reflected radiation generally constitutes only a small proportion of total radiation, except for locations surrounded by highly reflective surfaces such as snow cover. The solar radiation tools do not include reflected radiation in the calculation of total radiation. Therefore, the total radiation is calculated as the sum of the direct and diffuse radiation.
The solar radiation tools can perform calculations for point locations or for entire geographic areas. This involves four steps:
- The calculation of an upward-looking hemispherical viewshed based on topography.
- Overlay of the viewshed on a direct sun map to estimate direct radiation.
- Overlay of the viewshed on a diffuse sky map to estimate diffuse radiation.
- Repeating the process for every location of interest to produce an insolation map.
Hemispherical viewshed
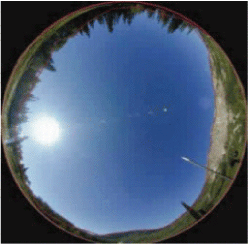
Since radiation can be greatly affected by topography and surface features, a key component of the calculation algorithm requires the generation of an upward-looking hemispherical viewshed for every location in the digital elevation model (DEM). The hemispherical viewsheds are similar to upward-looking hemispherical (fisheye) photographs, which view the entire sky from the ground up, similar to the view in a planetarium. The amount of visible sky plays an important role in the insolation at a location. For example, a sensor located in an open field has higher insolation than a sensor located in a deep canyon.
The following image depicts an upward-looking hemispherical photograph, which provides a view of the visible sky and the sky directions obstructed by the surrounding topography and surface features. This is similar to the view you would have from the ground looking up in all directions.
Viewshed calculation
The viewshed is a raster representation of the entire sky that is visible or obstructed when viewed from a particular location. A viewshed is calculated by searching in a specified number of directions around a location of interest and determining the maximum angle of sky obstruction, or horizon angle. For all other unsearched directions, horizon angles are interpolated. Horizon angles are then converted into a hemispherical coordinate system, thus representing a three-dimensional hemisphere of directions as a two-dimensional raster image. Each raster cell of the viewshed is assigned a value that corresponds to whether the sky direction is visible or obstructed. Output cell locations (row and column) correspond to zenith angle θ (angle relative to straight upward) and azimuth angle α (angle relative to north) on the hemisphere of directions.
The figure below depicts the calculation of a viewshed for one cell of a DEM. Horizon angles are calculated along a specified number of directions and used to create a hemispherical representation of the sky. The resultant viewshed characterizes whether sky directions are visible (shown in white) or obstructed (shown in gray). The viewshed is shown overlaid on a hemispherical photograph to demonstrate the theory.
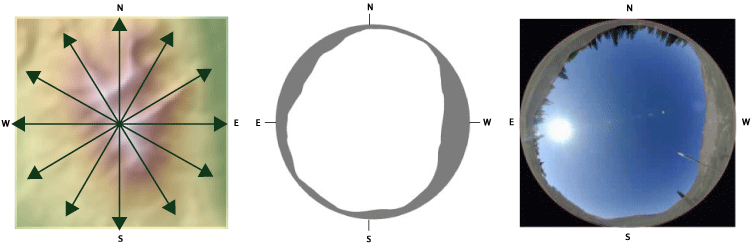
Viewsheds are used in conjunction with sun position and sky direction information (represented by a sun map and sky map, respectively) to calculate direct, diffuse, and total (direct + diffuse) radiation for each location and to produce an accurate insolation map.
Sun map calculation
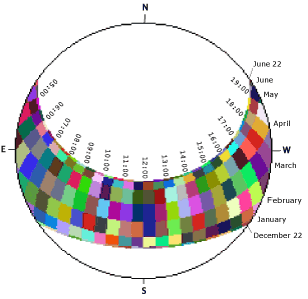
The direct solar radiation originating from each sky direction is calculated using a sun map in the same hemispherical projection as the viewshed. A sun map is a raster representation that displays the sun track, or apparent position of the sun as it varies through the hours of day and through the days of the year. This is similar to you looking up and watching as the sun's position moves across the sky over a period of time. The sun map consists of discrete sectors defined by the sun's position at particular intervals during the day (hours) and time of year (days or months). The sun track is calculated based on the latitude of the study area and the time configuration that defines sun map sectors. For each sun map sector, a unique identification value is specified, along with its centroid zenith and azimuth angle. The solar radiation originating from each sector is calculated separately, and the viewshed is overlaid on the sun map for calculation of direct radiation.
The following figure is a sun map for 45º N latitude calculated from the winter solstice (December 21) to summer solstice (June 21). Each sun sector (colored box) represents the sun's position using 1/2 hour intervals through the day and monthly intervals through the year. It should be noted that the image is in the same hemispherical projection as upward-looking viewsheds. The position of the sun is represented as it moves across the sky during the time of day and time of year.
Sky map calculation
Diffuse radiation originates from all sky directions as a result of scattering by atmospheric components (clouds, particles, and so forth). To calculate diffuse radiation for a particular location, a sky map is created to represent a hemispherical view of the entire sky divided into a series of sky sectors defined by zenith and azimuth angles. Each sector is assigned a unique identifier value, along with the centroid zenith and azimuth angles. Diffuse radiation is calculated for each sky sector based on direction (zenith and azimuth).
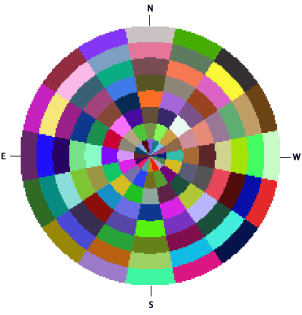
The figure below is a sky map with sky sectors defined by 8 zenith divisions and 16 azimuth divisions. Each color represents a unique sky sector, or portion of the sky, from which diffuse radiation originates.
Overlay of viewshed with sun map and sky map
During the insolation calculation, the viewshed raster is overlaid with the sun map and sky map rasters to calculate diffuse and direct radiation received from each sky direction. The proportion of visible sky area in each sector is calculated by dividing the number of unobstructed cells by the total number of cells in each sector. Allowance is made for partially obstructed sky sectors.
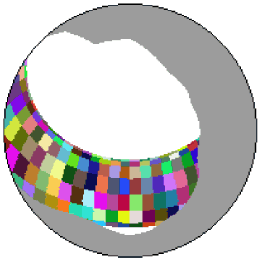
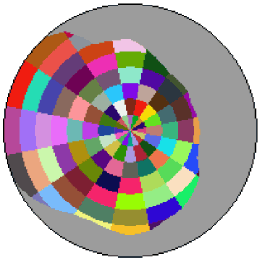
The following figure illustrates the overlay of a viewshed on a sun map and a sky map. Gray represents obstructed sky directions. Solar radiation is calculated by summing direct and diffuse insolation originating from the unobstructed sky directions.
Learn more about the equations used in calculating solar radiation