After you configure Neighborhood Explorer and apply a conceptualization of spatial relationships, you can explore the neighborhood of the features. You can visualize neighborhoods, examine neighbor weights, and view statistics that summarize the neighborhoods that result from the selected conceptualization of spatial relationships.
Select a focal feature
Neighborhood Explorer uses the specified conceptualization of spatial relationships to create a neighborhood for each feature in the feature layer.
To select a focal feature, complete the following steps:
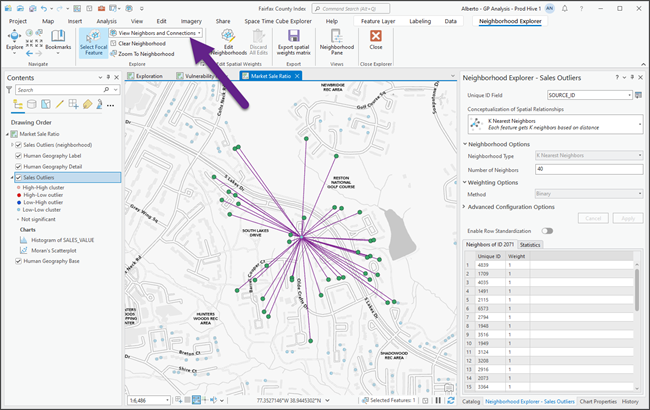
- On the Neighborhood Explorer ribbon, in the Explore section, click the Select Focal Feature button
 .
.
- Select a focal feature.
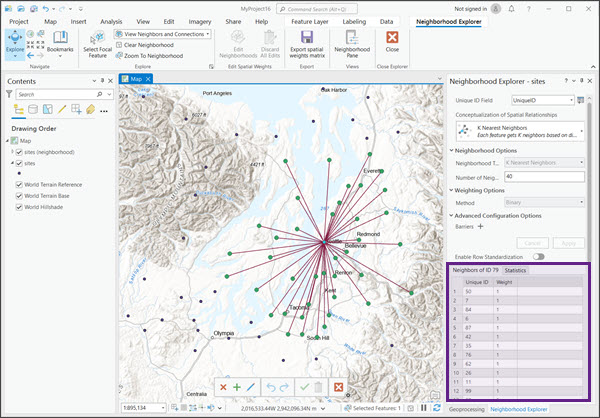
The focal feature is highlighted and its neighborhood is visualized. In the Neighborhood Explorer pane, the Neighbors of ID tab updates to include the ID of the selected feature. The table on the tab is populated with the neighbors of the selected focal feature.
Visualize neighborhoods
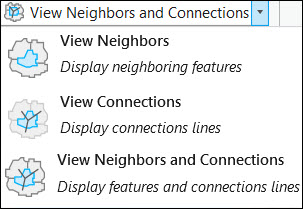
On the Neighborhood Explorer ribbon, in the Explore section, click the View Options drop-down menu and select a visualization option.
- View Neighbors—Features in the neighborhood are visualized. If the layer contains polygon features, each neighbor is outlined in black. If the layer contains point or line features, the neighbors are symbolized with a different size and color.
- View Connections—Neighbor connections (lines) that connect the focal feature to each of its neighbors are visualized. If the layer contains polygon or line features, a line connects the centroid of the focal feature to the centroid of each neighbor.
- View Neighbors and Connections—Both visualization strategies are applied. It emphasizes the neighbors and displays neighbor connections.

Neighborhood group layer
Neighborhood Explorer adds a group layer to the map. The group layer contains two feature layers, Neighbors and Connections, that visualize the neighborhood of the selected focal feature.
Note:
Control the visibility of the layers in the group layer with the View Options parameter.

If the visibility of the Neighbors layer or Connections layer is set in the Contents pane, the visibility will reset to the specified View Options parameter value.
You can change the symbology of the two feature layers to control how the neighbors and connections appear on the map. To change the symbology of a feature layer, expand the group layer, right-click the feature layer, and click Symbology. The Symbology pane appears where you can change the symbology.
Neighbors table
The Neighborhood Explorer pane includes a table with the neighbors of the selected focal feature. You can view the table on the Neighbors of ID tab followed by the ID of the selected focal feature.

As you select different focal features, the table updates with the neighbors of the new focal feature. The table includes a Unique ID column, with the ID of the neighbors, and a Weight column, with the spatial weights of the neighbors. If the Enable Row Standardization toggle button is on, the table includes a Standardized Weight column with row standardized weights. The row standardized weight of each neighbor is its weight divided by the sum of the weights of all the neighbors in the neighborhood.
You can also use the table to locate a neighbor on the map. Select a row in the table to highlight that feature on the map.
Summary statistics
The Statistics tab in the Neighborhood Explorer pane summarizes the neighborhoods that result when the configured conceptualization of spatial relationships is applied to the layer. The statistics include the following:
- Features—The total number of features in the layer
- Minimum Neighbor Count—The size of the smallest neighborhood
- Maximum Neighbor Count—The size of the largest neighborhood
- Mean Neighbor Count—The average size of a neighborhood
- Median Neighbor Count—The median size of a neighborhood
- Features Without Neighbors—The number (percent) of features without a neighbor