Disponible avec une licence Geostatistical Analyst.
Sometimes the values for the measured locations will contain a directional influence that can be statistically quantified but perhaps cannot be explained by any known identifiable process (see Accounting for directional influences). This directional influence is known as anisotropy. Anisotropy is used to analyze whether samples exhibit different ranges depending on direction. The angle of tolerance will determine the angle in which close points will be included or excluded until it reaches the bandwidth. The bandwidth specifies how wide the search should be when determining which pairs of points will be plotted in the semivariogram.
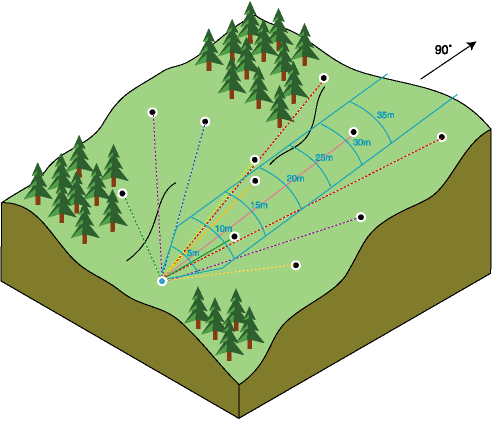
The points in the bins are pairs of locations that are within certain distances and directions apart. You can conceptually view directional binning either as limiting the pairs of points that will be graphed in the grouping process or by graphing all pairs and considering only the portion of the graph representing a certain direction. The scene below depicts a directional binning of 90 degrees, a bandwidth of 5 meters, an angle tolerance of 45 degrees, and a lag distance of 5 meters from a single sample point (in blue).

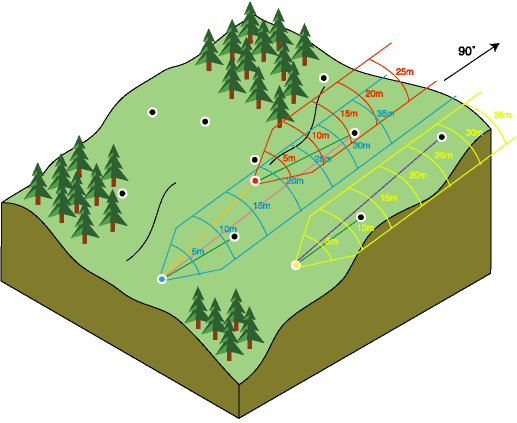
The directional search continues for each sample point on the surface. The scene below shows the directional binning of three points.
The pairs are then binned according to common distances and directions, the bins are averaged, and the average of the pairs for each bin is plotted on the semivariogram graph. The bin will be plotted on the semivariogram if the center of the cell on the semivariogram surface is included in the search direction.

Rubriques connexes
Vous avez un commentaire à formuler concernant cette rubrique ?