Overview
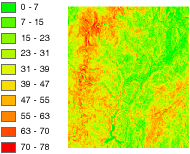
Slope represents the rate of change of elevation for each digital elevation model (DEM) cell. It's the first derivative of a DEM.

Notes
By default, the slope appears as a grayscale image. You can add the Colormap function to specify a particular color scheme, or allow the person viewing the mosaic to modify the symbology with their own color scheme.
This Slope function uses an accelerated ATan function. It is six times faster, and the approximation error is always less than 0.3 degrees.
Parameters
The inputs for this function are the following:
| Parameter name | Description |
|---|---|
DEM | The input elevation dataset. |
Scaling | The inclination of slope can be output as either a value in degrees, or percent rise. There are three options for the Scaling:
|
| Z Factor | The Z Factor is a scaling factor used to convert the elevation values for two purposes:
|
| Disable default edge pixel interpolation | Using this option will avoid any resampling artifacts that may occur along the edges of a raster. The output pixels along the edge of a raster or beside pixels without a value will be populated with NoData; therefore, it is recommended that this option be used only when there are other rasters with overlapping pixels available. When overlapping pixels are available, these areas of NoData will display the overlapping pixel values instead of being blank.
|
Learn more about how Slope works
Unit conversion
If the units of measure for the z (elevation) units are the same as the x,y (linear) units, the z-factor is 1.
If your data is in a projected coordinate system and your elevation and linear units of measure are different, you will need to define a z-factor to account for the difference.
To convert from feet to meters or vice versa, see the table below. For example, if your DEM's elevation units are feet and your mosaic dataset's units are meters, you would use a value of 0.3048 to convert your elevation units from feet to meters (1 foot = 0.3048 meters).
| Conversion Type | Conversion Factor |
|---|---|
From feet to meters | 0.3048 |
From meters to feet | 3.28084 |
If your data is using a geographic coordinate system (such as a DTED in GCS_WGS 84), where the linear units are in degrees and your elevation is in meters, use a conversion factor of 1, and the system will automatically convert your linear degrees to meters. If your elevation units are not in meters, use the Arithmetic function to convert your elevation to meters before using the Slope function.
Vertical exaggeration
To apply vertical exaggeration, you must multiply the conversion factor by the exaggeration factor. For example, if both elevation and dataset coordinates are meters and you want to exaggerate by a multiple of 10, the scaling factor would be the unit conversion factor (1.0) multiplied by the vertical exaggeration factor (10.0)—which would be a Z Factor of 10. If the elevation units are meters and the dataset is geographic (degrees), you would multiply the unit conversion factor (1.0) by the exaggeration factor (10.0)—which would be a Z Factor of 10.