Overview
The NDVI Colorized function applies the NDVI function on the input image, and then uses a color map or color ramp to display the result.
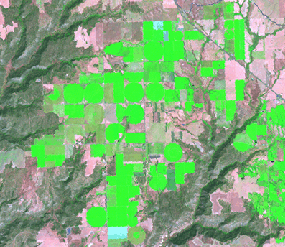
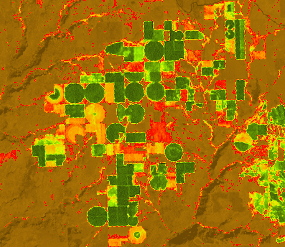
Below is an example of a Landsat scene using the 7,4,3 band combination on the left. On the right is the corresponding NDVI using a color map that highlights the agricultural activity. 

Notes
You can render or display your NDVI output with a color map or color ramp of your choice.
The default color map is named NDVI3. Red and orange pixels represent areas with no vegetation. Yellow pixels represent areas with low to moderate vegetation. Green pixels represent areas with high vegetation density and vigor.
Parameters
| Parameter | Description |
|---|---|
Raster | The input multispectral raster. |
Visible Band ID | Specifies the band ID that represents the red part of the electromagnetic spectrum. |
Infrared Band ID | Specifies the band ID that represents the near-infrared part of the electromagnetic spectrum. |
Scientific Output | The output values will range from -1.0 to 1.0, which is used in many scientific applications. |
Color Scheme Type | Choose which type of color scheme to colorize the NDVI output:
|
Colormap | Choose a predefined color map from the drop-down list. Alternatively, you can browse to an existing color map file. |
Color Ramp | Choose a predefined color scheme from the drop-down list. Alternatively, you can create your own color scheme using the Color Scheme Editor. |