Overview
This function allows you to specify an attribute table that is used to symbolize a single-band mosaic dataset or raster dataset. Use this function to present imagery that has undergone classification into categories, such as land cover, land use, risk factors, or temperature ranges.
Notes
- This function supports only 8-bit raster inputs.
- You can assign an existing attribute table with your color scheme, or you can create a new color attribute table.
- If your table contains fields named Red, Green, and Blue, values within those fields will be used like a color map when rendering the image.
- The attribute table is referenced when using this function even when it is not stored in the dataset, such as with raster datasets that contain internal attribute tables.
- When the dataset is displayed, it can be symbolized based on the table values. When a pixel is queried, the table values will be returned.
Parameters
| Parameter | Description |
|---|---|
Raster | The input raster. |
Table Type | The input attribute table can be entered using the Manual option, where you assign a class name and a color to each value, or you can reference an existing table that comes from one of the following:
|
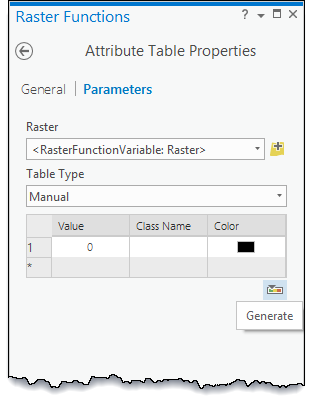
Add an attribute table manually
To manually add an attribute table, complete the following steps:
- Choose the Manual table type option.

- Click the Generate button.
- Click the Minimum Value and Maximum Value drop-down menus and set the values. The current range of values to choose from is between -127 and 127. You can specify a base name for the classes associated with each unique value, your color scheme, and the transparency. When you're finished, click OK.
- If you need to further refine colors, click the item in the color column and choose a color.