In ArcGIS Pro, you typically work in a project that is saved on your computer. However, you don't always need to save a project. Sometimes your tasks involve data preparation and management, and you don't need to make maps or solve analysis problems. In these situations, you can start ArcGIS Pro without creating a project. You can then process your data and close the application without saving a project.
Overview
- Video length: 11:42
- This video was created with ArcGIS Pro 3.3.
In this tutorial, you'll work with a number of datasets useful to environmental restoration projects in and around the city of Christchurch, New Zealand. You'll explore the data, convert it to a common file format and spatial reference, clip it to a study area, and update its metadata. The goal is to create a streamlined data collection in a geodatabase that can be shared by GIS professionals working on related projects in the same geographic area.
- Estimated time: 60 minutes
- Software requirements:
- ArcGIS Pro Basic
Note:
The quick-start tutorials are updated at each software release. For the best experience, use an online help version that matches your software version.
Download the data
The magnitude 6.2 earthquake that struck Christchurch, New Zealand, on February 22, 2011, killed 185 people and caused massive property damage. In some badly damaged parts of the city, rebuilding houses and infrastructure was not a realistic option.

In one such area, the Otakaro Avon River Corridor, a plan was developed to create a green spine of walkways, biking trails, and wetlands leading from the Avon River to the sea. Elsewhere in the city and surrounding area, many biodiversity and restoration projects are being carried out.
You'll download data relevant to restoration projects in and around Christchurch. The data comes from different sources, has different spatial extents and coordinate systems, and is in different file formats.
- Go to the Manage Data v330 overview page on ArcGIS Online.
- Click Download on the right side of the page.
- In the Downloads folder on your computer, right-click Manage_data_v330.zip and extract it to a convenient location, such as C:\Temp.
Note:
This tutorial is a learning exercise. However, the earthquake restoration projects in and around Christchurch—including the Otakaro Avon River Corridor Regeneration Plan—are real and ongoing. Information about the 2011 earthquake is available from many sources, including the Wikipedia 2011 Christchurch earthquake article.
Start ArcGIS Pro without a template
When you start ArcGIS Pro without a template, you are not prompted to create a project. In this tutorial, you'll create and manage data in a geodatabase, so there is no need to save your work as a project. Optionally, you can do so at any time during your ArcGIS Pro session.
This tutorial assumes that some default application settings are used. You'll check these settings and change them if necessary.
- Start ArcGIS Pro and sign in if necessary.
- On the start page, click the Settings tab
 .
. - In the list of side tabs, click Options. On the Options dialog box, under Application, click General.
- Expand Create projects and expand On a local or network computer. Under Geodatabase, if necessary, click New default geodatabase for each project.

- On the Options dialog box, under Application, click Metadata. If necessary, click the Metadata style drop-down arrow and click Item Description.
- Click OK on the Options dialog box.
- If you changed the default geodatabase setting, close and restart ArcGIS Pro. Otherwise, click Back at the top of the settings page.
- On the start page, under New Project, click Start without a template.

The application starts with no open views.
Add a folder connection
You'll add a folder connection to the tutorial data and browse the data.
- On the ribbon, click the View tab. In the Windows group, click Reset Panes
 and click Reset Panes for Geoprocessing.
This ensures that the Contents, Catalog, and Geoprocessing panes are open and that other panes are closed.
- Make the Catalog pane active and confirm that the Project tab is selected. Expand the Databases and Folders containers.

When you start ArcGIS Pro without a template, a default geodatabase and home folder are created in a temporary directory in your user profile.
Tip:
To see the path, hover over the default geodatabase (Default.gdb) or the home folder (Untitled).
- In the Catalog pane, right-click the Folders container
 and click Add Folder Connection.
 - On the Add Folder Connection browse dialog box, browse to the location where you extracted the tutorial data (for example, C:\Temp). Click the Manage_Data folder to select it.

- Click OK.
In the Catalog pane, the folder connection appears under the Folders container
 .
.Note:
You don't need to add a connection to the Supplemental folder. If your active portal is an ArcGIS Enterprise portal, you will use data in this folder later in the tutorial; otherwise, you don't need it.
- In the Catalog pane, expand the Manage_Data folder.
It contains three folders, two geodatabases, and a shapefile.
- Expand the folders and geodatabases.

The folders contain shapefiles. Each geodatabase contains two or three feature classes.
Preview data
Most of this data is relevant to Christchurch restoration projects. You'll examine the datasets to learn more about them. To preview data and metadata, you'll open a catalog view.
- On the ribbon, confirm that the View tab is selected. In the Windows group, click Catalog View
 .
.A catalog view opens. On the ribbon, the Catalog tab appears. The Contents pane shows the contents of the catalog.
Note:
Catalog views and the Catalog pane are complementary. They have similar functionality, but certain tasks, such as previewing data, can only be done in a catalog view.
- In the Contents pane (not the Catalog pane), under Project
 , expand Folders
  . Expand the Manage_Data folder and click Planning.gdb.
The contents of the geodatabase appear in the catalog view. There are two feature classes: AvonRiver and PlanArea.
- In the catalog view, click PlanArea.

The catalog view details panel displays metadata for the selected feature class.
Tip:
If the details panel isn't showing, click the View tab on the ribbon. In the Options group, click Details Panel
 to select it. (This button is also located at the bottom of the catalog view.) In the catalog view, you can move the vertical separator between the list of items and the details panel.
 - Scan the item metadata.
- At the top of the details panel, click the Geography tab.
The spatial data is previewed on a light gray basemap.
- Click the plan area feature on the geography preview.
The feature flashes and the Pop-up pane appears. The pop-up identifies the feature as Otakaro/Avon River Corridor Regeneration Plan. This is the area designated to be a green spine of walkways, bike paths, wetlands, and community spaces.
- Close the Pop-up pane.
Note:
Closing the pop-up causes the preview to redraw, and the feature color may change.
- At the top of the details panel, click the Table tab to preview the attributes of the feature class.
The table has one record with name and area attributes. To learn more about the dataset, you'll open its properties.
- In the catalog view, right-click the PlanArea feature class and click Properties
 .
. - On the Feature Class Properties dialog box, on the Source tab, expand Spatial Reference.

The projected coordinate system is WGS 1984 Web Mercator Auxiliary Sphere. A world projection, such as Mercator, is not ideal for a local dataset. You'll change the projection later.
- Click Cancel.
- In the Contents pane, click the Boundaries geodatabase. In the catalog view, click CommunityBoards.
- Preview the metadata, geography, and table of this feature class.
- Open the CommunityBoards feature class properties and check its spatial reference.
The projected coordinate system of this feature class is NZGD 2000 New Zealand Transverse Mercator, which is a standard for New Zealand maps and data. One of your goals in this tutorial is to put all the datasets in this coordinate system.
- Click Cancel.
- Optionally, preview some of the other datasets in the Manage_Data folder.
Explore the data in a map
You'll add the datasets to a map to explore them further. You'll do this from the Catalog pane.
- In the Catalog pane, confirm that the contents of the Manage_Data folder are still expanded.
- Press the Ctrl key and click the following datasets to select them. Don't select the Parks shapefile.
- Historic_Places
- Native_Bird_River_and_Open_Water_Habitat
- River_Centerlines
- District_Plan_Zones_Open_Space
- Flat_Land_Recovery
- CommunityBoards
- Districts
- Region
- AvonRiver
- PlanArea
- Right-click any of the selected datasets, point to Add To New
 , and click Map
  .
.A map view named Map opens. The Contents pane lists the map layers.
- In the Catalog pane, click Parks.shp to select it. Drag it onto the map.

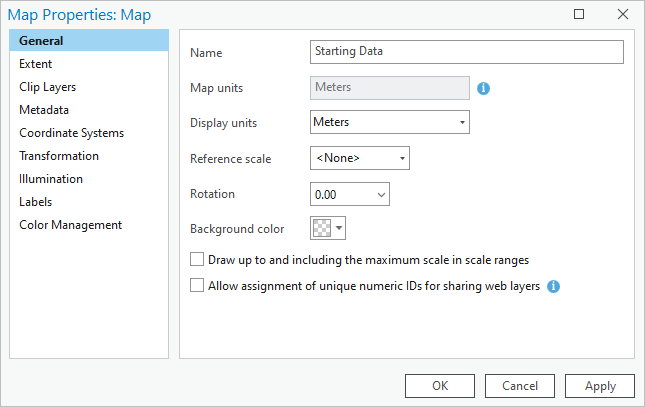
Your layers may be symbolized in different colors. They may also draw in a slightly different order. - In the Contents pane, under Drawing Order, double-click Map to open the map properties.
- On the Map Properties dialog box, on the General tab, change the default map name from Map to Starting Data.
- Click OK.
The map name is updated in the Contents pane and on the map view tab.
- In the Contents pane, click the Region layer to select it. Drag it down in the Contents pane to a position just above the World Topographic Map layer.
As you drag the layer, its position is indicated by a thin horizontal line.
- Drag the CommunityBoards layer above the Region layer. Drag the Districts layer above the CommunityBoards layer.
Now the layers of administrative boundaries don't obscure features in other layers.
- In the Contents pane, right-click the PlanArea layer and click Zoom To Layer
 .
.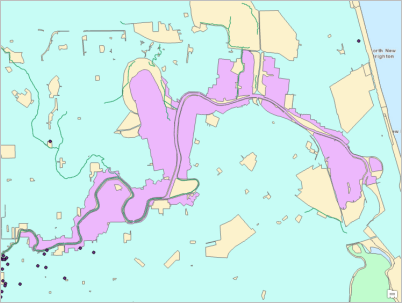
Restoration projects may be located outside the plan area but probably not too far outside. You'll look for a dataset that can help define the area of interest.
- In the Contents pane, right-click the Districts layer and click Attribute Table
 .
.Each district in the Districts layer is represented by a row in the attribute table.
- In the table, click the number four row header (the gray square at the left edge of the row) to select the record for Christchurch City.

- In the row of tools at the top of the table, click Zoom To
 .
.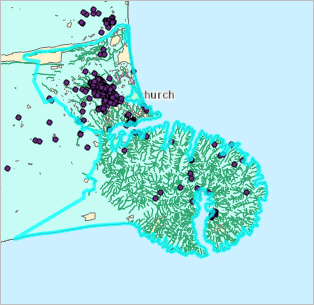
The Christchurch City feature is selected on the map. The district is a small area but still larger than you need because it includes Banks Peninsula, a circular outcropping that is not part of the restoration area.
- In the row of tools at the top of the table, click Clear
 .
. - Close the Districts table.
You could explore other map layers for a feature to represent your area of interest, but instead you'll search ArcGIS Living Atlas of the World.
Add data from ArcGIS Living Atlas of the World
ArcGIS Living Atlas of the World is a collection of authoritative geographic information curated by Esri.
Note:
If your active portal is ArcGIS Enterprise rather than ArcGIS Online, the layer added in this section is not available to you from ArcGIS Living Atlas. You can add an equivalent layer from the Supplemental folder in the data you downloaded:
- On the ribbon, on the Map tab, in the Layer group, click Add Data
 .
. - On the Add Data browse dialog box, under Computer
 , browse to C:\Temp\Supplemental (or the directory where you downloaded the data).
 - Click NZ Urban Rural Indicator Areas.lyrx to select it and click OK.
- Continue with step 6 in this section.
- On the ribbon, confirm that the Map tab is active. In the Layer group, click Add Data
 .
. - On the Add Data browse dialog box, under Portal, click Living Atlas
 .
. - Click in the search box at the top of the Add Data browse dialog box. Type New Zealand urban areas and press the Enter key.
- In the list of search results, click the NZ Urban Rural Indicator Areas - Current web feature layer to select it.

Your list of search results may be different. - Click OK.
The layer is added to the map.
- Zoom in on the urban area of Christchurch, the large orange patch in the center of the view.

- In the Contents pane, confirm that the NZ Urban Rural Indicator Areas layer is selected.
- On the ribbon, on the Map tab, in the Navigate group, click the Explore tool
 drop-down arrow and click Selected in Contents.
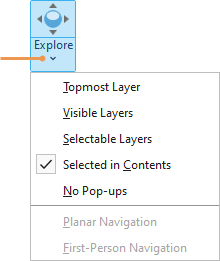
Now, when you click a map feature, the Pop-up pane will show information for the layer (or layers) selected in the Contents pane.
- On the map, click the Christchurch urban area.
The feature flashes on the map. The Pop-up pane confirms that the feature represents the urban area of Christchurch. You'll use this feature to define your study area.

- Close the Pop-up pane.
You'll work with this layer throughout the tutorial, so you'll give it a shorter name.
- In the Contents pane, double-click the NZ Urban Rural Indicator Areas layer to open its properties.
- On the Layer Properties dialog box, on the General tab, replace the current name with Urban Area.

- Click OK.
The layer is renamed in the Contents pane.
- Click the Explore tool
 drop-down arrow and click Topmost Layer.
This is the default setting for the tool.
Create a geodatabase in a new folder
As you process the starting data, you'll save your output datasets to a new geodatabase in a new folder. This is the geodatabase and folder you'll share with GIS specialists working on Christchurch restoration projects. You'll set the new geodatabase as the default location for data that you create.
- Make the catalog view active (not the Catalog pane).
- In the Contents pane, under Project, right-click the Databases container
 and click New File Geodatabase
  .
. - On the New File Geodatabase browse dialog box, browse to the folder where you extracted the tutorial data (for example, C:\Temp). Double-click the folder to open it.
The Manage_Data and Supplemental folders are listed. You'll create another folder to contain the new geodatabase. You can do this in the process of creating the geodatabase.
- On the browse dialog box, click the New Item drop-down arrow and click Folder
 .
.
The new folder is created. Its default name is editable.
- Rename the folder ChristchurchRenewal and press the Enter key.
The new folder is selected.
- Click Open to open the ChristchurchRenewal folder (which is empty).
- In the Name text box at the bottom of the dialog box, type ChristchurchData as the name of the new geodatabase. Click Save.
The new geodatabase is created and added to the project.
- In the Contents pane, click the Databases container
 .
.The new geodatabase appears in the catalog view under the default geodatabase that was created when you started without a template.
The default geodatabase, marked with a home icon
 , is the one to which most geoprocessing outputs are saved unless otherwise specified. Any geodatabase can be set as the default geodatabase. (The fact that the current default geodatabase is named Default.gdb is irrelevant.)
 - In the catalog view, click ChristchurchData.gdb to select it.
- On the ribbon, click the Manage tab. In the Project group, click Make Default
 .
.The home icon now appears on the ChristchurchData geodatabase.
Clip data and save it to the new geodatabase
You'll clip most of the data in the Manage_Data folder to the Christchurch urban area using the Pairwise Clip geoprocessing tool. (Pairwise Clip is an improved version of the traditional Clip tool.) You'll run the tool as a batch tool, which allows you to process multiple input datasets in one operation. The new output data will be saved to the ChristchurchData geodatabase. Input shapefiles will be converted to geodatabase format automatically.
Clipping features changes their geometry. For example, a river that crosses the boundary of the Christchurch urban area will be split at the boundary. Only the segment that lies inside the boundary will be preserved.
As mentioned earlier, you want your output data to be in the New Zealand Transverse Mercator coordinate system. Before you run the Pairwise Clip tool, you'll make a tool environment setting that projects the input datasets as needed to this coordinate system.
- Make the Starting Data map view active.
- In the Contents pane, right-click the Urban Area layer, point to Selection, and click Make this the only selectable layer
 .
. - On the ribbon, on the Map tab, in the Selection group, click Select
 . On the map, click the Christchurch urban area feature to select it.
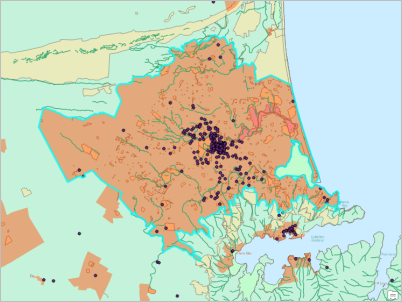
When you run the Pairwise Clip tool, you'll specify the Urban Area layer as the clip layer. The tool will use the selected feature as the clip extent.
- Make the Geoprocessing pane active. In the search box, type pairwise clip.
In the search results, Pairwise Clip is the first result listed.
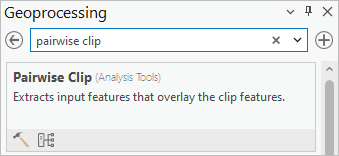
Tip:
To change the display of tools, at the bottom of the Geoprocessing pane, click Display tools with descriptions and details
 or Display tools as a list
  .
. - In the search results, right-click the Pairwise Clip tool and click Batch.
The Batch Pairwise Clip tool opens. Most geoprocessing tools can be run as batch tools. Batch tools are temporary by default, but you can save a batch tool to make it permanent.
- For Choose a batch parameter, confirm that Input Features is selected. Uncheck the Add output datasets to an open map check box.

After the tool runs, you'll add the output datasets to a new map instead.
- Click Next.
- Next to Batch Input Features, click Add Many
 . Next to the search bar, check the Toggle All Checkboxes check box.
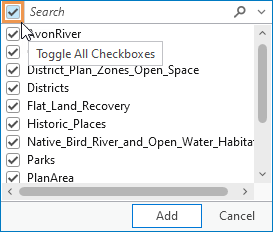
All the layers in the map are selected. However, you don't want to clip all of them. The boundary layers should keep their territorial integrity, so you'll process them separately.
- In the list of layers, uncheck the check boxes for the following layers:
- CommunityBoards
- Districts
- Region
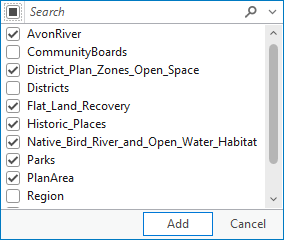
The Urban Area layer is included with the input features to be clipped. The layer will be clipped to its own selected feature, which is what you want.
- At the bottom of the drop-down list, click Add.
A toggle button appears under Urban Area because there is a selection on the layer. By default, only the selected records are processed.
- For Clip Features, click the drop-down arrow and click Urban Area.

The toggle button again appears under the Urban Area layer.
- In the Output Feature Class box, delete the prefix PairwiseClip_OutFeatureClass_ from the output feature class name and leave the %Name% variable.
Caution:
Do not delete the entire path to the output geodatabase. Deleted paths may not regenerate correctly when you run batch tools.
The output feature class path goes to the ChristchurchData geodatabase because it is the default geodatabase.

The %Name% variable assigns the input layer name to the output dataset. Because you're saving the output data to a different location than the input data, you don't need a file name prefix (such as PairwiseClip_OutFeatureClass_) to prevent naming conflicts.
Although map layers in different coordinate systems are aligned spatially through on-the-fly projection, you want your output data to be created in the NZGD 2000 New Zealand Transverse Mercator system. You'll make an environment setting to project the input datasets to this system as needed.
Geoprocessing environment settings are parameters that are not built into a tool but can be applied to the output data when the tool runs. In this case, using an environment setting means that you don't need to run the Project tool on datasets that are in the Web Mercator coordinate system.
- At the top of the Batch Pairwise Clip tool, click the Environments tab.
- Next to Output Coordinate System, click Select coordinate system
 .
. - On the Coordinate System dialog box, under XY Coordinate Systems Available, expand Layers.
The two coordinate systems used by layers in the map are listed.
- Click NZGD 2000 New Zealand Transverse Mercator to select it.

- Click OK.
Input datasets in the Web Mercator coordinate system, such as PlanArea, will be projected to New Zealand Transverse Mercator when they are clipped.
- In the Geographic Transformations input box, type (or copy and paste) NZGD_2000_To_WGS_1984_1. Press the Enter key.

This geographic datum transformation ensures that the datasets are projected as accurately as possible.
- In the Geoprocessing pane, click Run
 .
.When the tool finishes, a completion message appears at the bottom of the pane.
View the clipped data
You'll examine the output datasets in the ChristchurchData geodatabase and add them to a new map.
- Make the catalog view active.
- In the Contents pane, under Project
 , expand Databases
  if necessary. Click ChristchurchData.gdb.
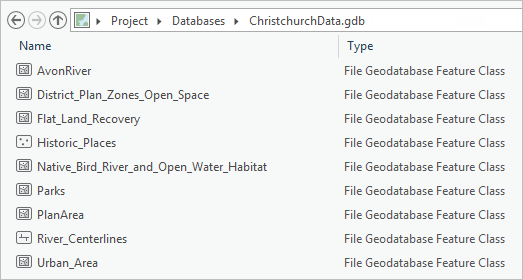
In the catalog view, you can see that there are nine feature classes in the geodatabase.
- In the catalog view, click the PlanArea feature class to select it. Right-click the selected feature class and click Properties
 .
. - On the Feature Class Properties dialog box, on the Source tab, expand Spatial Reference.

The dataset has been projected to the New Zealand Transverse Mercator coordinate system as specified by the geoprocessing environment settings.
- Click Cancel.
- Click the AvonRiver feature class to select it. Press the Shift key and click Urban_Area to select all the feature classes.
- Right-click any selected feature class and click Add To New > Map
 .
.A new map view named Map opens.
- In the Contents pane, double-click Map to open the map properties.
- On the Map Properties dialog box, on the General tab, change the name from Map to Final Data. Click OK.
The map name is updated in the Contents pane and on the map view tab.
- In the Contents pane of the Final Data map, drag the Urban_Area layer to a position just above the World Topographic Map basemap layer.

Your symbol colors will be different. - Zoom out on the map to confirm that all the layers are clipped to the extent of the Christchurch urban area.
Select features by location
When you ran the Pairwise Clip tool, you didn't process the boundary layers because you want to preserve their territorial integrity. However, these layers cover a much larger part of the Canterbury region than you need. You'll make a spatial selection of the features in the CommunityBoards and Districts layers that have area in common with the Christchurch urban area. In the next section, you'll copy these selected features as new datasets to the ChristchurchData geodatabase.
- Click the Starting Data map view to make it active.
- Press the Ctrl key. In the Contents pane, click the Urban Area layer to deselect it. With the Ctrl key still pressed, click the Districts and CommunityBoards layers to select them.
You'll leave out the Region layer. It contains a single feature representing the Canterbury region and is too general for your needs.
- On the ribbon, on the Map tab, in the Clipboard group, click Copy
 .
. - Make the Final Data map view active.
- In the Contents pane, at the top of the drawing order, click the Final Data map to select it.
- On the ribbon, on the Map tab, in the Clipboard group, click Paste
 .
.The two layers are pasted at the top of the drawing order.
- On the ribbon, on the Map tab, in the Selection group, click Select By Location
 .
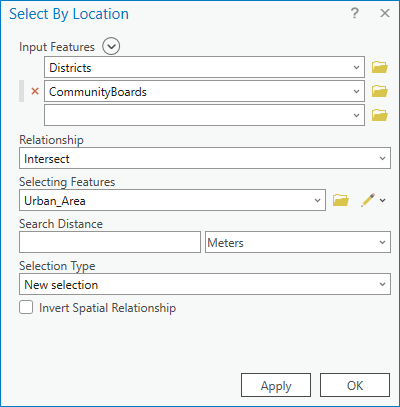
.The Select By Location tool opens. The Input Features parameter is used to specify the features you want to select. The Districts layer, which is selected in the Contents pane, should already appear in the list of input features.
Note:
For convenience, some geoprocessing tools open in a floating window. You can also open these tools in the Geoprocessing pane.
- For the Input Features parameter, under Districts, click the drop-down arrow next to the first empty input box and click CommunityBoards.
- Confirm that the Relationship parameter is set to Intersect.
- For Selecting Features, click the drop-down arrow and click Urban_Area.
- Click OK.
When the tool finishes, features in the input layers are selected if they intersect the urban area. In the status bar at the bottom of the map view, you can see that there are 10 selected features.
- In the Contents pane, right-click the Districts layer, point to Selection, and click Zoom To Selection
 .
.These two boundary layers are relevant to your final data because restoration projects may be subject to local political jurisdiction. Although the extent of the selected features is larger than your area of interest, it is smaller than the full extent of the layers.
- At the top of the Contents pane, click the List By Selection tab
 .
.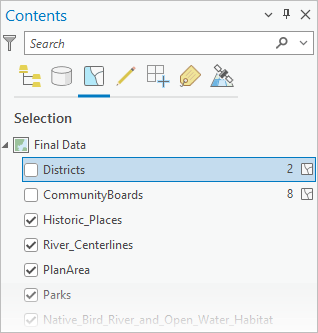
Two features in the Districts layer and eight features in the CommunityBoards layer are selected.
- Click the List By Drawing Order tab
 .
.You no longer need to work with the original map.
- Make the Starting Data map view active. Click Close
 on its view tab.
The Final Data map is now the active view.
Note:
The closed map is still available. It can be reopened from the Maps container
 in the Catalog pane or from the Contents pane of the catalog view.
Copy the boundary layers to the geodatabase
You'll copy the selected features to new feature classes in the ChristchurchData geodatabase using the Copy Features tool as a batch tool.
- Make the Geoprocessing pane active.
- At the top of the Geoprocessing pane, click Open Another Tool
 . In the list of options, click Open Another Tool to search for a tool you haven't used.
 - Click in the search box and type copy features.
In the search results, Copy Features is the first result.
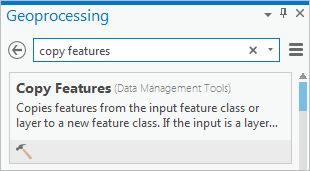
- Right-click the Copy Features tool and click Batch.
The Batch Copy Features tool opens. In this case, you'll accept the default setting to add the output datasets to the open map.
- Under Choose a batch parameter, confirm that Input Features is selected and click Next.
- Next to Batch Input Features, click Add Many
 .
. - In the list of layers, check the boxes for the CommunityBoards and Districts layers. Click Add.
The tool displays toggle buttons and the number of selected records in each layer.
- In the Output Feature Class text box, delete the prefix CopyFeatures_OutFeatureClass_ and leave the variable %Name%.
Caution:
Do not delete the entire path to the output geodatabase. Deleted paths may not regenerate as desired when running batch tools.
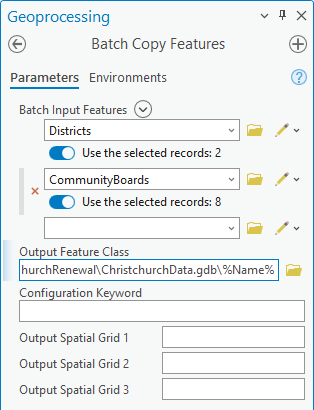
You don't need to make an environment setting for the output coordinate system. Both input layers are in the NZGD 2000 Transverse Mercator coordinate system.
- In the Contents pane, uncheck the check boxes for the Districts and CommunityBoards layers to turn them off.
This will reduce confusion when new layers with the same names (but different data sources) are added to the map.
- In the Geoprocessing pane, click Run
 .
.When the tool finishes, the new layers are added to the map. You no longer need the original layers.
- In the Contents pane, click the Districts layer that is turned off to select it. Press the Ctrl key and click the CommunityBoards layer that is turned off to select it also.
- Right-click either selected layer and click Remove
 .
.Tip:
If you make a mistake, click Undo
 on the Quick Access Toolbar to undo your most recent action.
 - In the Contents pane, drag the Districts layer to a position just above the World Topographic Map layer. Drag the CommunityBoards layer above the Districts layer.
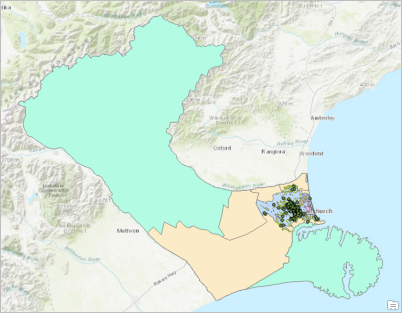
Both layers extend beyond the Christchurch urban area because they are not clipped. However, only the features that intersect the urban area are included.
- Make the catalog view active.
The ChristchurchData geodatabase now includes the new CommunityBoards and Districts feature classes.
Update metadata
The metadata from your input datasets in the Manage_Data folder was copied to the new datasets in the ChristchurchData geodatabase. You'll review the metadata to correct spelling errors and update item descriptions. You'll also create a thumbnail image that will appear in the metadata.
- In the catalog view, right-click the Native_Bird_River_and_Open_Water_Habitat feature class and click Edit Metadata
 .
.A metadata view opens. Wavy red lines appear under several words. These include spelling errors, unrecognized technical terms, and unusual place-names.
Note:
If you don't see the wavy red underlines, you must enable spell-checking.
- Scroll through the metadata view.
The Description field contains two adjacent spelling mistakes.

- Right-click the first mistake (acommpany) and click the suggested replacement accompany.
The mistake is corrected and the red underline is removed.
- Correct the spelling mistake Emvironment to Environment in the same way.
At the bottom of the Description field, a note describes changes that have been made to the original source data. You'll add another note.
- In the Description field, click at the end of the text and press the Enter key to add a second bullet point.
- Type or copy the following sentence: The data was converted to geodatabase format and clipped to the Christchurch urban area.
- On the ribbon, on the Metadata tab, in the Manage Metadata group, click Save
 .
. - Close the metadata view.
- In the catalog view, in the details panel, click the Metadata tab if necessary.
The spelling errors in the description are fixed. The note you added appears at the bottom of the description.
- In the details panel, click the Geography tab.
The data is previewed on a light gray basemap.
- On the ribbon, click the Preview tab. In the Preview group, click Basemap
 and click Oceans.
The basemap changes in the geography preview.
- In the Thumbnail group, click Create
 .
. - In the details panel, click the Metadata tab. If the thumbnail image doesn't display immediately, click a different dataset in the catalog view and click Native_Bird_River_and_Open_Water_Habitat again.
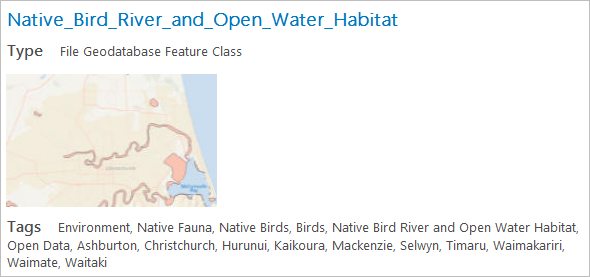
Note:
If you still don't see the thumbnail image, right-click the ChristchurchData geodatabase in the Contents pane, click Refresh
 , and try again.
 - Optionally, edit the item descriptions and create thumbnail images for some other datasets.
Note:
All the datasets have metadata except the Urban_Area feature class. You can import metadata from the NZ Urban Rural Indicator Areas - Current web layer by following these steps:
- Select the Urban_Area feature class in the catalog view. On the ribbon, on the Catalog tab, in the Metadata group (not the Create group), click Import
 .
. - On the Import Metadata dialog box, click Browse
 .
. - On the browse dialog box, under Portal, click Living Atlas
 and search for NZ Urban Rural Indicator Areas - Current.
 - Click the layer to select it and click OK. Confirm that the layer URL is added to the Import Metadata dialog box.
- Click OK to import the metadata.
Because you started without a template, no project file was saved to your computer (unless you saved the project on your own). The working maps you made were useful for exploring data and choosing input layers for tools, but you don't need to keep them.
- Select the Urban_Area feature class in the catalog view. On the ribbon, on the Catalog tab, in the Metadata group (not the Create group), click Import
- On the ribbon, click the Project tab. In the list of side tabs, click Exit. When you are prompted to save your changes, click No.
The ChristchurchData geodatabase is complete. The ChristchurchRenewal folder, containing the geodatabase (along with any documentation or README files you want to add), is ready to be shared with restoration teams. The folder can be put on a network or distributed by standard file sharing methods. It can also be uploaded to ArcGIS Online as a .zip file.
