Generate a report to share a well-formatted, multipage representation of your data. A report can contain a tabular list of attributes, summary information, or both.
For example, a report could list all the manholes in a sewer network, summarize the sales figures for a chain of stores, or list all the parcels in a neighborhood and provide statistics on property values and tax revenue. Reports are often designed to be generated on a regular basis—such as monthly or quarterly. Reports are used for a variety of decision-making purposes, such as identifying and reacting to trends over time.
Add a new report to your project
When you add a new report to your project, you create a view in which you set up the structure of the report. Use the Create New Report pane to specify the data to show in the report and to set the report's properties. The Create New Report pane provides a report authoring sequence, or you can accept the default configuration. Each page of the pane allows you to configure the following:
- Set the name and data source for the report
- Filter the data to specify the rows and fields
- Organize the data using grouping and sorting
- Design the report using templates and styles
The final report is generated when you export it as a PDF file. You can share the reports in a project when you share a project package or a report file. Reports, like other project items, are listed in the Catalog pane and Catalog view in a dedicated category.
Sections and elements
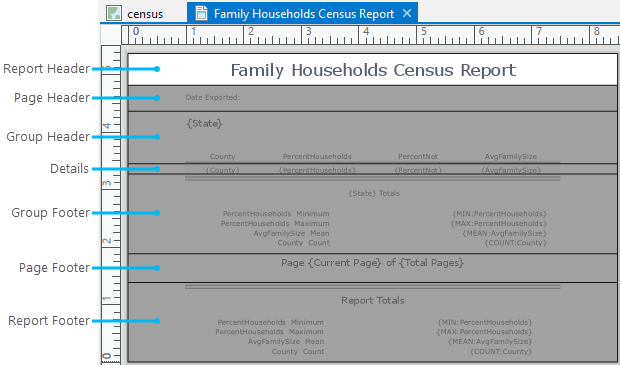
Reports are divided into sections. Each section identifies a particular area of the report and helps provide structure. Common report sections include Report Header, Report Footer, Page Header, and Page Footer. If optional grouping is defined, Group Header and Group Footer are also included for each grouping level. Sections control the display of information by formatting the fields used and adding queries or statistics.
The Report Header section typically includes the report title, and the Page Footer section includes dates or page numbers. You can also add sections after you create a report.

Sections contain elements for text and images. They can be either dynamic or static and have configurable properties including font, size, and background color. Only the selected element or section can be edited.
Terminology list for reports
The following table lists report terminology and definitions:
| Term | Definition |
|---|---|
Header | The report section that contains introductory information. It can be customized to include additional report elements such as images or dynamic text. There are three possible header sections: Report Header, Page Header, and Group Header. |
Footer | The report section that contains summary information and page numbers. It can be customized to include additional report elements such as summary statistics, images, or dynamic text. There are three possible footer sections: Report Footer, Page Footer, and Group Footer. |
Details | The section of a report that contains attribute information. These attributes can be grouped or sorted to organize your data. |
Report Elements | Items that can be added to a report to provide context, style, or more information such as attachments, images, or text boxes. Elements can be either dynamic or static. |
Summary Statistics | Calculations that provide an overview of the data in the report include sum, mean, count, and standard deviation. These appear in the Group Footer and Report Footer sections by default. |
Report Template | Chosen when designing the report, each template dictates the location of elements in a report. |
Report Styling | Chosen when designing the report, each style designates the appearance properties of the report elements. |