A skyline analysis provides the understanding of the shape of the horizon from one or more viewpoints. The horizon can include surfaces and features, like buildings, combined to understand the physical environment. A suite of 3D Analyst geoprocessing tools allows you to conduct a skyline analysis in ArcGIS Pro. The Skyline, Skyline Barrier, and Skyline Graph geoprocessing tools, when run sequentially, can help you conduct a full skyline analysis.
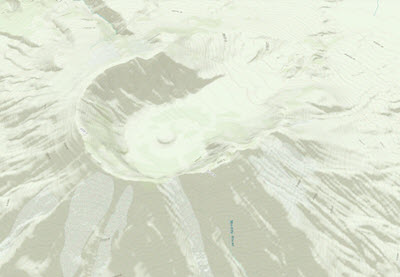
As an example to help you understand how to use these tools to conduct a skyline analysis, the graphic below shows a birds-eye view of the Mount St. Helens crater. Imagine that there is an observer standing in the bottom center of the crater looking around. You want to analyze the horizon from the observer point around the top of the crater. You can create a 3D line depicting the locations that are visible from the observer point and then quantify it. To do this, you can start by running the Skyline geoprocessing tool to create the 3D horizon line. The skyline might be similar, but not identical, to the ridgeline.
Skyline
The first step in this analysis is to create a skyline using the Skyline geoprocessing tool. The tool generates a 3D line representation of the line separating the sky from the surface and features surrounding each observer point. The minimum input data that you need to build a skyline is an observer point and a terrain. The observer point represents a view point where an observer is standing. The surface, which can be a Triangulated Irregular Network (TIN) or raster surface, is used to determine the farthest place on the surface visible to the observer and above which the observer sees only the sky. Once you have these two inputs set in the Skyline geoprocessing tool, you generate a skyline as shown in the image below. If features are provided in the input, the tool can generate silhouettes of those features that participate in the skyline; those silhouettes can then be used by the Skyline Barrier geoprocessing tool to generate shadow volumes.
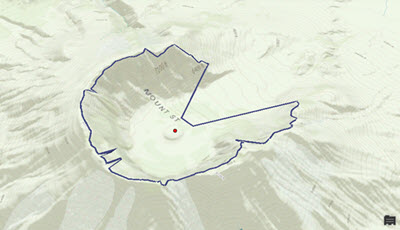
The red dot in the center of the crater represents an observer standing at the bottom center of the crater. The dark blue line is the output of the Skyline geoprocessing tool, which shows how far the observer can see, in all directions, around the surface.
Skyline Barrier
To help visualize the skyline in 3D, you can then use the Skyline Barrier geoprocessing tool.
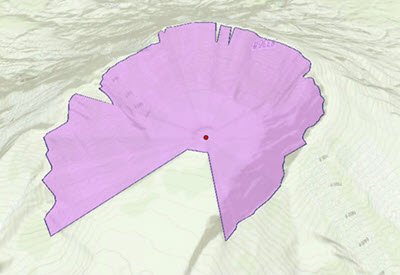
The Skyline Barrier geoprocessing tool generates height control surfaces from skylines. They are defined between observation points and the skylines associated with these points. A barrier can be used to detect whether a feature of interest is above the horizon, and therefore visible, or would modify the skyline if incorporated into the scene. The tool can also generate a shadow volume, which can in turn be used to determine whether features are shaded or hidden by the features, or surface, used to generate the skyline from which the barrier was created.
You must provide two inputs to the tool: one is the observer point, and the other is the skyline, which is a 3D line that you generated from the output of the Skyline geoprocessing tool that you used previously. In the graphic below, you can see a red dot, which is the input observer point, and the is the skyline barrier created, which is a multipatch feature created by the tool. The composition of this multipatch feature is a collection of triangles emanating from the center observer point.
Skyline Graph
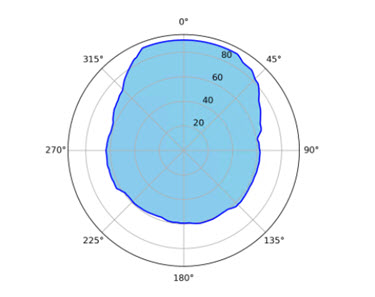
If you want to derive quantitative measurements from a skyline analysis, use the Skyline Graph geoprocessing tool. The Skyline Graph geoprocessing tool calculates the sky visibility ratio and generates an optional table and a polar graph.
Like the Skyline Barrier geoprocessing tool, the Skyline Graph geoprocessing tool requires an observer point and a skyline as inputs. The output is a polar graph and an optional table. The following image is the polar graph output from Skyline Graph. The blue area shows the sky exposure, which is what you would see if you lie on your back and look up to the sky. The center of the graph is at the observer point. The angles surrounding the graph represent the azimuth from the observer, and the angles on the concentric rings are the zenith angle (the larger the zenith angle, the more sky that can be seen in that horizontal direction).
The table below shows the output table from the Skyline Graph geoprocessing tool. The fields are defined as the following:
- HORIZ_ANG—Arithmetic angle, starting from east at 0 degrees and going counterclockwise, which ranges from 0 to 360 degrees.
- ZENITH_ANG—Angle from top down, which ranges from 0 to 90 degrees.
- HOR_AN_GEO—Geographic angle, starting from north at 0 degrees and going
clockwise. Its value is calculated using the formula:
, which ranges from 0 to 360 degrees. Mod 360 indicates that if the number to its left is 360 or greater, subtract 360 from that number.Geographic = (450 - Arithmetic) mod 360 - ZEN_AN_INV—Angle from bottom up, which ranges from 0 to 90 degrees. It's complementary to ZENITH_ANG, meaning that 90 is the combined value.

There are two pairs of angle values that are important in this table.
The first pair consists of horizontal angles. The values in the HORIZ_ANG column are arithmetic angles, where 0 represents due east and the angle increases counterclockwise. HOR_AN_GEO is an azimuth or geographic angle; its origin 0 is due north, and it increases clockwise. The following graphics may help in understanding these concepts.
This is a map view, or orthographic view. For the Mount St. Helens crater, the opening is to the north, with the azimuth/geographic angle at 0 and arithmetic angle at 90, as shown in the image below.
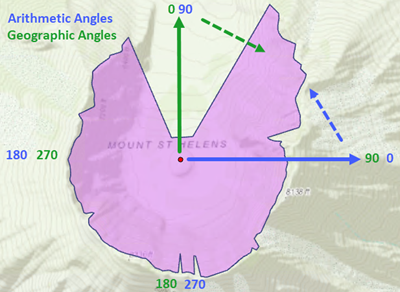
To obtain geographic azimuth from arithmetic angle, the following formula is used:
Geographic = (450 - Arithmetic) mod 360For example, for an arithmetic angle of 180 (west), the geographic angle is
(450 - 180) mod 360 = 270 (west)(450 - 30) mod 360 = 420 mod 360 = 60The second pair consists of vertical angles, as you can see from the above table in the ZENITH_ANG and ZEN_AN_INV fields, which are complementary. Their relationship is much simpler and can be illustrated with the image below.

One useful message is the return value of the Skyline Graph tool:
Skyline Graph geoprocessing messages: Percent of sky visible above a base vertical angle of 0.000000 degrees is 64.448665.
The minimum and maximum vertical angles are 0.000000 and 32.605258 degrees.
The first part indicates percentage of the sky exposure, assuming you calculated from horizontal up. You could specify the base elevation angle by typing a value in the Base Visibility Angle parameter on the tool. For example, you could type 15 degrees there, which means that at a 15 degree elevation angle, you want to calculate the sky exposure above that threshold. The default value is 0, meaning the calculation is based at the same elevation as the observer.
The second part of the message indicates the minimum and maximum elevation angles from the ZEN_AN_INV column in the output table of the Skyline Graph geoprocessing tool.
The Skyline suite of tools—Skyline, Skyline Barrier, and Skyline Graph—provide visual feedback as well as quantitative measures of how open or closed a certain physical site is.