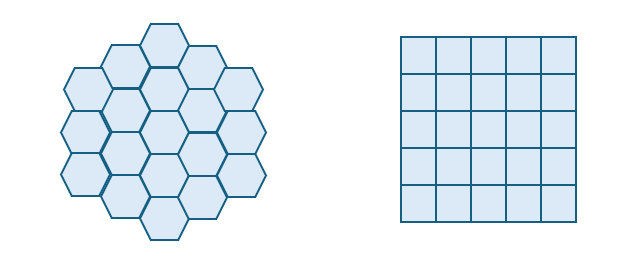
Hexagons are six-sided polygons that are used in GIS to apply a uniform grid on a map. In ArcGIS Business Analyst Pro, you can create grids and hexagons, and they are also available as a geography option when creating color-coded layers.
H3 hexagons use the open-source hierarchical spatial indexing system, H3, which is commonly used in GIS. Using hexagons in GIS provides a consistent-size grid across an area, unlike using administrative boundaries with varying sizes across an area. The boundaries of hexagons are also consistent over time, unlike administrative boundaries such as block groups or ZIP codes.
Using squares in a grid (or fishnet grid) has been a common GIS practice but is not always preferable since the linearity of squares may inhibit the underlying patterns in the data. Hexagons visually represent curves in the patterns of data and aspects of connectivity or movement paths more naturally than squares. A hexagon grid also suffers less distortion due to the curvature of the earth.
Example
A commercial health organization in Wisconsin is analyzing state-wide trends in health-care preferences. The organization uses hexagons in a color-coded layer with two different resolutions to analyze areas of highest preference for urgent care facilities over doctor's offices.
They select a variable from the Market Potential data, Prefer Urgent vs Docs Office: Agree Completely, and set the area of interest to Wisconsin. The variable is mapped using resolution 5 hexagons.
Hexagons vary in size (or resolution) from 0 (largest) to 15 (smallest). For a state-wide analysis, resolution 5 hexagons cover a large area, aiding the organization's analysis by providing a broad visualization of data. For more information on hexagon resolutions, see Hexagon resolutions.
There are a large number of people who prefer urgent care facilities concentrated around Milwaukee, which the organization wants to further evaluate. They change the area of interest to the city of Milwaukee and change the hexagons to resolution 7. This larger resolution hexagon covers a smaller area per hexagon and is applicable to local analysis since it provides a more specific visualization of data.
By using hexagons for their analysis, the organization can see spatial patterns without the bias that traditional administrative geographic boundaries may introduce.
Calculations
Hexagons are six-sided polygons that tessellate. Tessellation is when polygons repeat in a pattern in which each unit fits with its neighbor without gaps or overlapping. This continuous pattern allows the curvature of data to be uninterrupted, unlike using squares in a grid on a map.

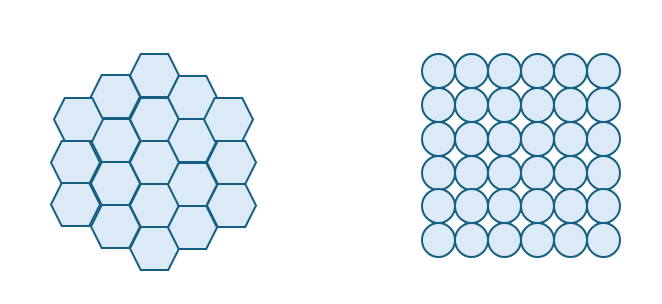
The shape of the hexagon provides a unique advantage in data analysis and visualization. For instance, a circle can be inscribed within a hexagon. A circle has the lowest perimeter-to-area ratio, which reduces sampling bias, but it cannot tesselate continuously. (A repeating pattern of circles has gaps or overlaps, which is not effective for analysis.) However, a hexagon can tesselate while having a low perimeter-to-area ratio.

Note:
For more information on frequently asked questions about H3 hexagons, see Why hexagons?
Hexagon resolutions
Hexagons vary in size, from 0 (largest) to 15 (smallest). The different size is called resolution. Using smaller resolution hexagons (such as resolution 1) is useful for analysis of larger geographic areas, such as country-wide analysis. Bigger resolution hexagons (such as resolution 15) cover a smaller average area per hexagon, resulting in more hexagons covering the same area.
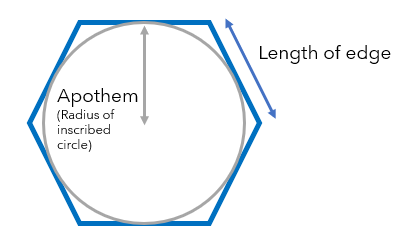
The radius of the circle inscribed within the hexagon is called the apothem. The length of the edge of the hexagon is equal on all sides. The apothem and side length of a hexagon are not always equal.

See the table below for more information on H3 resolution and its corresponding number of cells, average area, and average edge length. Note that in the table, the units of measurement change as the size of the hexagons decrease.
| Resolution | Average hexagon area | Average length of hexagon edge | Average inscribed circle radius (apothem) | |||
|---|---|---|---|---|---|---|
0 | 4,357,449.4 km² | 1,682,420.6 miles² | 1,281.3 km | 796.1 miles | 1,109.60 km | 689.47 miles |
1 | 609,788.4 km² | 235,440.6 miles² | 483.1 km | 300.2 miles | 418.34 km | 259.94 miles |
2 | 86,801.8 km² | 33,514.4 miles² | 182.5 km | 113.4 miles | 158.06 km | 98.21 miles |
3 | 12,393.4 km² | 4,785.1 miles² | 69.0 km | 42.9 miles | 59.74 km | 37.12 miles |
4 | 1,770.3 km² | 683.5 miles² | 26.1 km | 16.2 miles | 22.58 km | 14.03 miles |
5 | 252.9 km² | 97.6 miles² | 9.9 km | 6.1 miles | 8.53 km | 5.30 miles |
6 | 36.1 km² | 13.9 miles² | 3.7 km | 2.3 miles | 3.23 km | 2.00 miles |
7 | 5.2 km² | 2.0 miles² | 1.4 km | 0.9 miles | 1.22 km | 0.76 miles |
8 | 737,327.6 m² | 182.2 acres | 0.5 km | 581.2 yards | 0.46 km | 435.87 yards |
9 | 105,332.5 m² | 26.0 acres | 200.8 m | 219.6 yards | 173.89 m | 164.69 yards |
10 | 15,047.5 m² | 3.7 acres | 75.9 m | 83.0 yards | 65.70 m | 62.22 yards |
11 | 2,149.6 m² | 0.5 acres | 28.7 m | 31.3 yards | 24.82 m | 23.51 yards |
12 | 307.1 m² | 367.3 yards² | 10.8 m | 11.8 yards | 9.38 m | 8.88 yards |
13 | 43.9 m² | 52.5 yards² | 4.1 m | 4.5 yards | 3.54 m | 3.36 yards |
14 | 6.3 m² | 7.5 yards² | 1.5 m | 1.7 yards | 1.34 m | 1.27 yards |
15 | 8,950.0 cm² | 1.1 yards² | 0.6 m | 0.6 yards | 0.51 m | 0.48 yards |
Limitations
The limitations for using hexagons include the following:
- ArcGIS Business Analyst Pro provides H3 hexagons as a mapping or geography option only for the following workflows:
- Generate grids and hexagons (as a mapping option)
- Create a color-coded layer (as a geography option)
- For color-coded layers, hexagons are available in local Business Analyst datasets and in the following online datasets:
- Esri 2023 and Esri 2024
- Europe (Beta)
- If hexagons do not intersect any census blocks, data is not apportioned for them.
Credits
The Generate Grids and Hexagons geoprocessing tool consumes credits when the data source is set to online and the Enrichment Type parameter is specified.
See the Generate Grids and Hexagons section of Geoprocessing tools that use credits for more information.
Resources
For more information on hexagons and using hexagons in Business Analyst, see the following: