Iterators enable batch processing and help repeat a process or set of processes on a set of inputs.
For
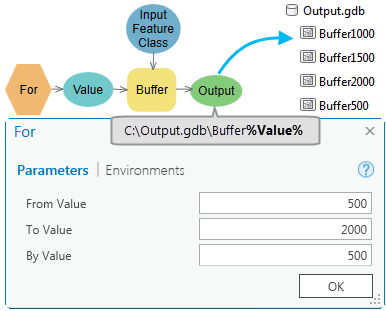
The For tool iterates over a starting and ending value by a given value.
In the image below, the For iterator iterates from a value of 500 to a value of 2,000, increasing by increments of 500. The output of For is used as the Buffer Distance parameter in the Buffer tool and in the output name as inline variable substitution.
While
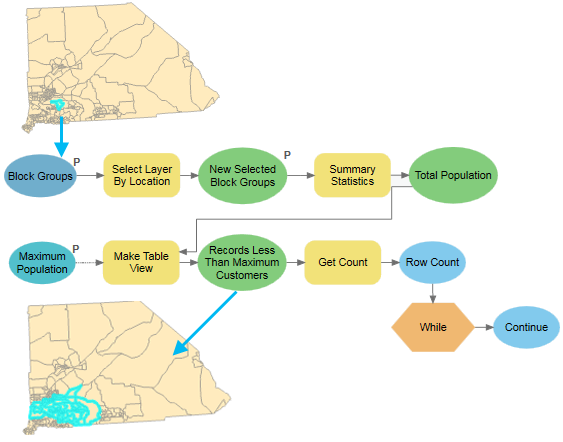
The While tool iterates until a condition becomes true or until a condition becomes false.
In the image below, the model selects all the block groups that share a boundary with an area of interest, calculates its total population, and makes a layer in which the population is less than a threshold value—for example, a business trying to reach a set population value for coupon offers surrounding a particular block group. The Get Count tool checks to see if there are any selections that match the criteria set in the Make Table View tool. The While tool ensures that the model runs until the row count is not zero.
Iterate Feature Selection
The Iterate Feature Selection tool iterates over features in a feature class.
In the image below, the model calculates how much of the East Coast land-cover map area was destroyed by a 100-meter swath of five category 1 hurricanes. The Input Feature variable is a feature class of five Atlantic hurricane paths with a 100-meter buffer around it. The Input Raster variable is a land-cover raster.
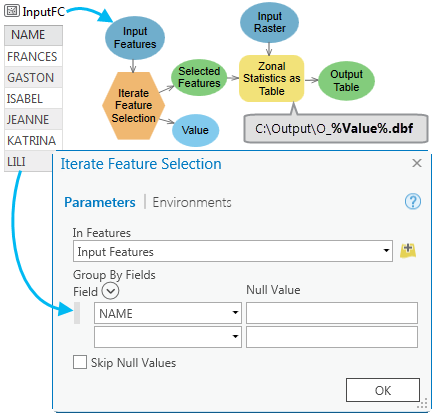
In this example, the name of the hurricane has been used as a grouping field to make the selection, and the selected feature is used as the input for the Zonal Statistics As Table tool to generate an output table with statistics on the land cover destroyed during the hurricanes' landfall.
The Iterate Feature Selection tool has two outputs:
- Selected feature (connected as input to the Zonal Statistics As Table tool).
- The Value variable, which contains the name of the feature (based on the grouping field) used as an inline variable in the output name of the Output Table variable.
Iterate Row Selection
The Iterate Row Selection tool iterates over rows in a table.
In the image below, the model creates a deviational ellipse for theft incidents during different periods of the day—morning, afternoon, evening, and night—to detect an underlying pattern of crime.
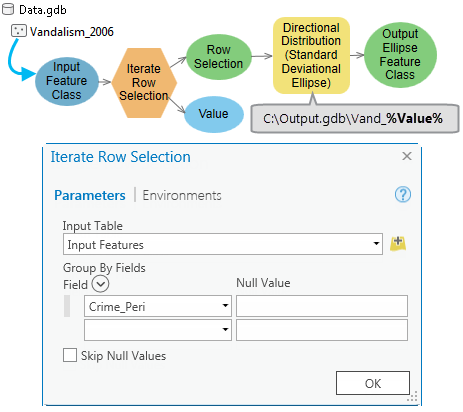
The Input Feature Class variable is a feature class containing vandalism incident points. It contains the field Crime_Peri (crime period), which is the time of day the incident occurred (the strings Morning, Afternoon, Evening, and Night). This field is used as the grouping field to make the selection, and the selected rows are used to create an output standard deviational ellipse.
The tool has two outputs:
- The Row Selection variable containing the selected rows for a unique crime period. These rows are input to the Directional Distribution (Standard Deviational Ellipse) tool.
- The Value variable, which contains the value of the grouping field (Morning, Afternoon, Evening, or Night). This value is used as an inline variable in the output name of the Output Standard Deviational Ellipse variable.
Iterate Fields
The Iterate Fields tool iterates over fields in a table.
In the image below, the model uses the Calculate Field tool to convert the null values in multiple fields to zeros.
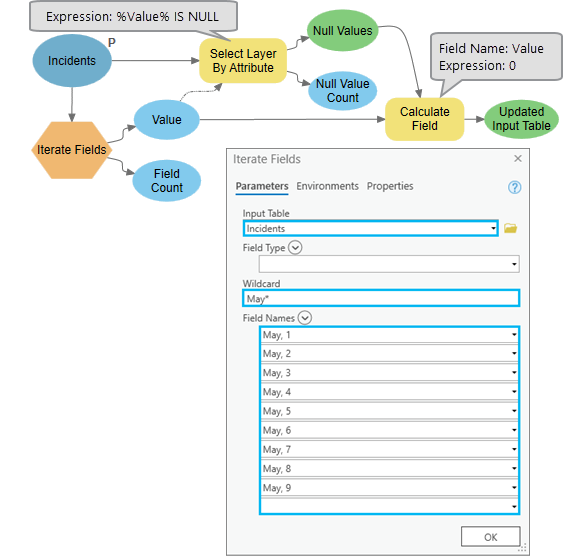
The Incidents feature layer variable has unique fields with count for number of incidents by date. Some of the fields have missing values stored as nulls. In this case, the Iterate Fields tool is used to filter the days based on a wild card and a subset of filtered field list. Each field is then passed to the expression of the Select Layer By Attribute tool, and the selected records are then passed to the Calculate Field tool.
The tool has two outputs:
- The Value variable is connected as the input field name to the Select Layer By Attribute tool.
- The Count variable keeps a total count of number of fields to iterate over.
Iterate Field Values
The Iterate Field Values tool iterates over each value in a field.
In the image below, the model uses the Cluster And Outlier Analysis tool for the number of people below the poverty line in each county to compare the results at different distances. These distances are recorded as the Distance field in the Input Table variable.
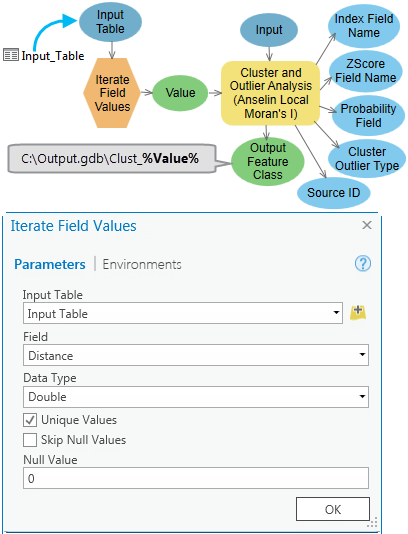
Note that on the Iterate Field Values dialog box, the Unique Values option is checked by default to iterate over each unique value in a table. Unchecking the Unique Values option will iterate for each value in the field, and the output value will be repeated if there are duplicate values in the input field.
Iterate Field Values has one output: the Value variable containing the value of the field, which is used as the Distance Band or Threshold distance parameter of the Cluster And Outlier Analysis tool. The Value variable is also used to construct the output file name of the Output Cluster Feature Class variable with the use of inline variable substitution.
Iterate Multivalue
The Iterate Multivalue tool iterates over a list of values.
In the image below, the model changes the map projection of several feature classes stored in different drives and workspaces. The projected output feature classes are written to a single output database.
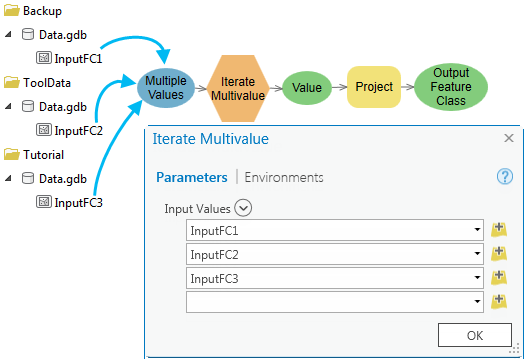
The tool has one output: the value, which is a string of feature classes connected to the Project tool as input.
Iterate Datasets
The Iterate Datasets tool iterates over datasets in a workspace or feature dataset.
In the image below, the model copies all the feature datasets contained in the Input Dataset variable, a workspace variable. The iteration has been restricted to iterate only on the feature dataset type.
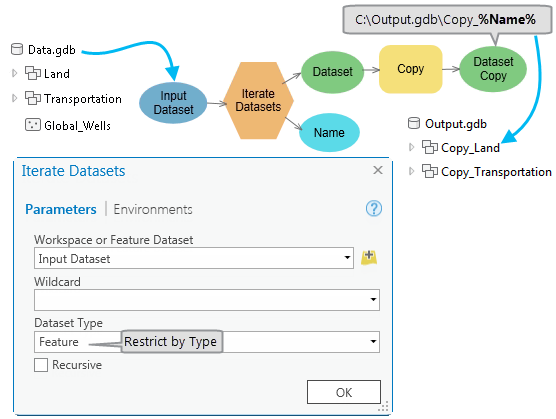
The tool has two outputs:
- Dataset (Land and Transportation).
- Name, which is used as the inline variable %Name% in the output of the Copy tool.
Iterate Feature Classes
The Iterate Feature Classes tool iterates over feature classes in a workspace or feature dataset.
In the image below, the model finds the population density for the Blocks and Parcels feature classes in the Input Feature Classes variable.
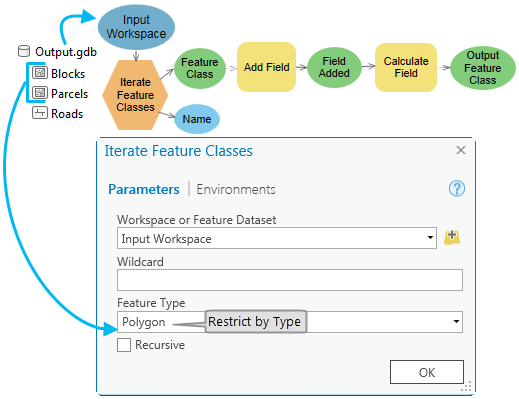
The iteration has been restricted by choosing the polygon feature type; therefore, the iterator only iterates on the Blocks and Parcels polygon feature classes.
The tool has two outputs:
- Output Feature Class variable (Blocks and Parcels) connected to the Add Field tool as input.
- Name variable (Blocks and Parcels, in this example), which could be used as the inline variable %Name% in other tools.
Iterate Files
The Iterate Files tool iterates over files in a folder.
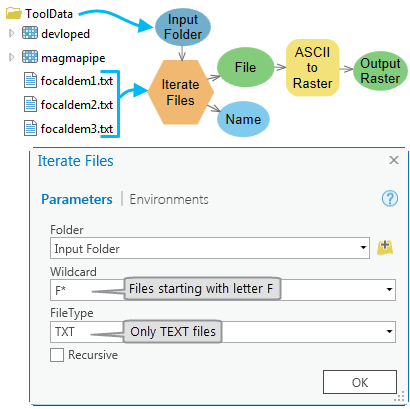
In the image below, the Input Folder variable has a list of text files to be converted to raster. The iteration has been restricted with a wildcard f* and the file extension .txt so that it will only iterate over files starting with the letter f or F and of type text.
The tool has two outputs:
- The File variable (focaldem1.txt, focaldem2.txt, or focaldem3.txt) connected as input to the ASCII To Raster tool.
- The Name variable containing the name of the text file (focaldem1, focaldem2, or focaldem3). This Name variable is used in the output of the next tool as an inline variable %Name%.
Iterate Layers
The Iterate Layers tool iterates over layers in a map.
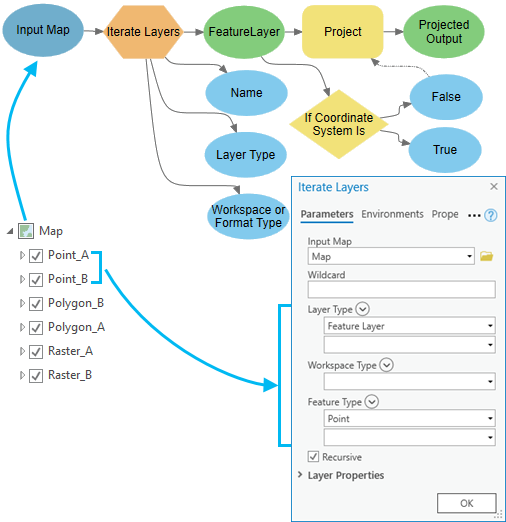
In the image below, the Input Map variable shows a list of layers to be projected. The iteration is restricted to only iterate over point feature layers in the map. The output of the Iterate Layers tool is tested against a defined coordinate system using the If Coordinate System Is tool. If the coordinate system of a layer does not match the defined coordinate system, the value of the output False variable changes to true and the connected Project tool runs to project the incoming layer to a specified coordinate system.
Iterate Time
The Iterate Time tool iterates over time in a Date field.
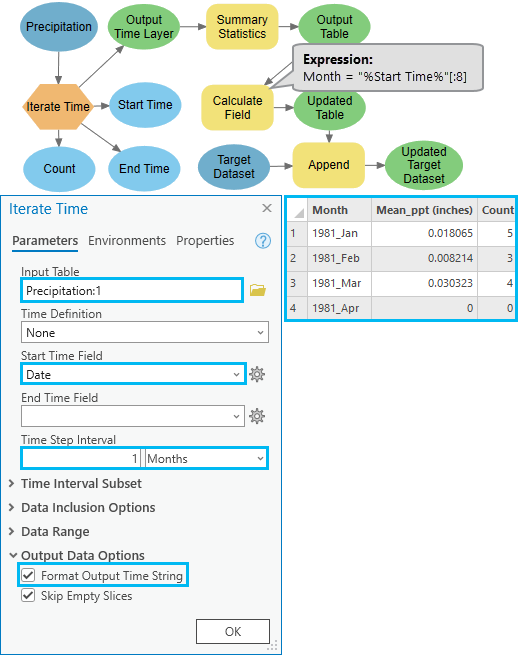
In the example below, the input table has precipitation data from 1981 to 2020 excluding dry days. The Iterate Time tool divides the input data into one month temporal slices using the Date field. From the selected rows for each month, the average precipitation and the count of rainy days are calculated using the Summary Statistics tool. The Calculate Field tool is used to add the formatted Start Time value of each iteration in the summarized table using inline variable substitution. The summary table for each month is appended to generate a single table using the Append tool.
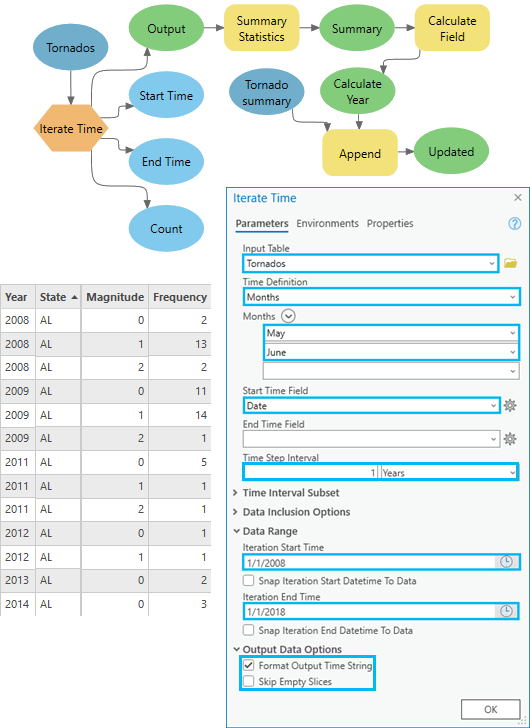
In the example below, the input table has tornado data, with magnitude, from 2000 to 2018. The model summarizes the frequency of tornados by magnitude for the months of May and June for a subset of data between the years 2008 and 2018. The Iterate Time tool divides the input data into yearly temporal slices using the Date field. The tool confines the data range based on the values defined in the Iteration Start Time, Iteration End Time, and Time Definition parameters. The tornados are summarized using the Summary Statistics tool, and the Calculate Field tool adds the year to the output. Finally, the yearly outputs are appended into a single table.
Iterate Rasters
The Iterate Rasters tool iterates over rasters in a workspace.
In the image below, the model resamples grid datasets and extracts a subset for further analysis.
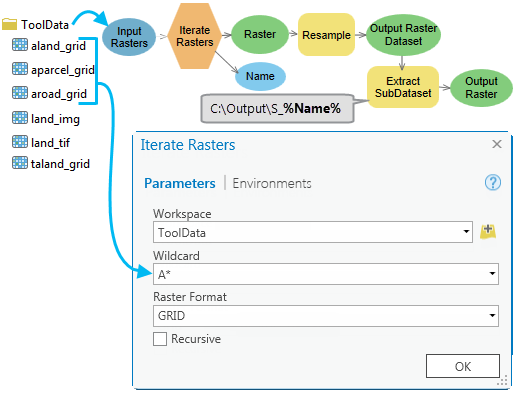
The Input Rasters variable is a folder containing grids, images, and .tiff files. In this case, iteration has been restricted with a wildcard A* and raster type of grid so that it only iterates over rasters starting with the letter a or A and only on grids.
The tool has two outputs:
- Output Raster variable (Aland, Aparcel, and Aroad) connected as input to the Resample tool.
- Name variable, which is used in the output name of the Resample and Extract Subset tools as the inline variable %Name%.
Iterate Tables
The Iterate Tables tool iterates over tables in a workspace.
Iterate Tables (dBASE tables)
In the image below, the model transposes land-cover tables of each state with a land-cover type and summarizes the statistics—such as sum of the area—for each class of land cover.
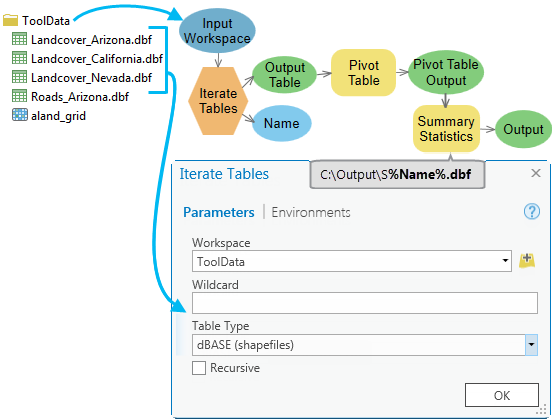
The input workspace variable is a folder containing the tables. The iteration has been restricted with a wildcard L* and a table type of dBASE so that it only iterates over dBASE tables starting with the letter l or L.
The tool has two outputs:
- Output Table variable (Landcover_Arizona, Landcover_California, and Landcover_Nevada) connected to the Pivot Table tool as input.
- Name variable, which is used as an inline variable %Name% in the output names of the Pivot Table and Summary Statistics tools.
Iterate Tables (Excel tables)
In the image below, the model iterates through all the sheets in a Excel table and exports them to a geodatabase. The input Excel table works as a workspace for the iterator. The tool creates an output path to individual sheets in the Excel workspace and also returns the name of the sheet which is used as an inline variable for the output name of the Export Table tool.

Iterate Tables (CSV tables)
In the example below, the Iterate Tables tool iterates through a folder containing .csv files. The tool creates an output path to individual .csv files and also returns the name of the .csv file which can be used as an inline variable for the output name of the XY Table To Point tool. The XY Table To Point tool takes the XY coordinates from each .csv file and creates a corresponding feature class.
Iterate Workspaces
The Iterate Workspaces tool iterates over workspaces in a folder.
In the image below, the model creates a mosaic using rasters stored in a geodatabase named Arizona, which is stored inside a folder.
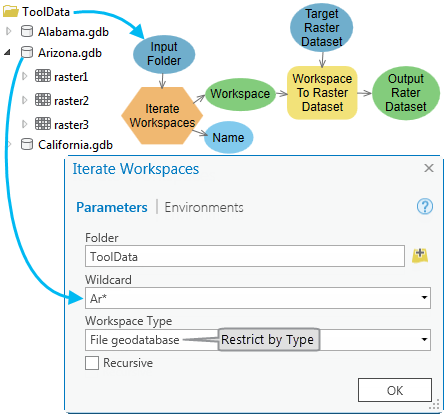
The iteration has been restricted with the wildcard Ar* and workspace type of file geodatabase so that it only iterates over file geodatabases with names starting with the letters Ar.
The tool has two outputs:
- Output Workspace variable, containing Arizona.gdb, is connected to the Workspace To Raster Dataset tool as input.
- Name variable, which can be used as an inline variable %Name% in the output name of subsequent tools.