Available with Image Analyst license.
A spectral library is a database of reference spectra that supports accurate material identification and classification in imagery. It is a library of spectral signatures that represent how different materials reflect, absorb, or emit energy across the electromagnetic spectrum. Each spectral signature in the library is like a dictionary definition for a material, such as vegetation type, soil type, minerals, water, constructed materials, and more. While these libraries can be built from field measurements or carefully calibrated imagery, most authoritative spectral libraries are derived from spectrometers used in laboratory environments. A spectral signature in the library contains reflectance values, and the wavelength ranges at which these reflectance values are collected.
The spectral signatures are often resampled to match some well-known airborne or spaceborne sensors, or they may be reflectance measured from an image. Analysts use them to compare and match image pixel spectra, helping identify or classify materials in satellite, aerial, and drone imagery.
Spectral library support
ArcGIS supports the following spectral library and formats:
- USGS Spectral Library—The library contains spectra measured with laboratory, field, and airborne spectrometers, covering wavelengths from the ultraviolet to the far infrared (0.2 to 200 microns). Laboratory samples of specific minerals, plants, chemical compounds, and constructed materials are measured. Spectral library data includes material name, spectral range, and number of bands.
- Esri Spectral Library—An Esri Spectral Library (.esl) file stores the sensor, material name, lists of wavelengths, and values.
- ENVI Spectral Library—An ENVI Spectral Library (.sli) is a binary file format used to store collections of spectral signatures, with a companion header (.hdr) that contains metadata such as wavelengths, units, and material names.
Browse and view spectral libraries
ArcGIS Pro provides a spectral library browser and spectral signature viewer to visualize and work with spectral signatures in a spectral library.
Spectral Library Browser
The Spectral Library Browser pane allows you to open, browse, search, and view the selected spectral signatures in a spectral library.
To open the Spectral Library Browser pane, on the Imagery tab, click the Spectral Analysis button, and then click New Spectral Signature Viewer. The upper panel of the Spectral Library Browser pane lists the spectral signatures contained in the spectral library in a table. The table includes the name of the material, range of the spectral signature, and the number of bands defining the spectral signature. You can choose to display the list of spectral signatures in either tree view or list view.

For details about Spectral Library Browser functionality, refer to Working with the Spectral Library Browser.
Spectral Library Viewer
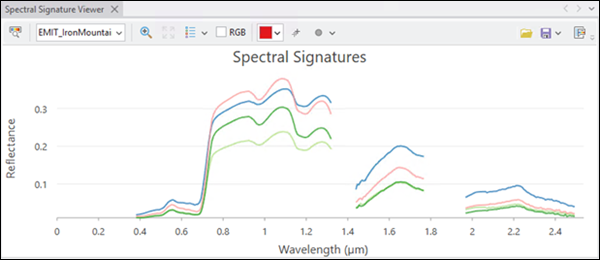
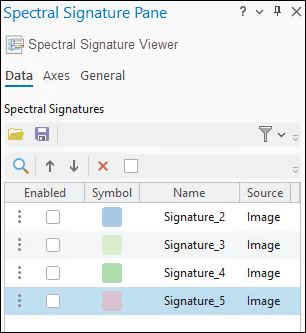
The Spectral Library Viewer window allows you to open, browse, search, and view the selected spectral signatures in a spectral library. Examine and measure spectral signatures using the tools, select spectral signatures of interest, and save them in a new Esri spectral library file (.esl). The Spectral Signature Viewer window has two components: the signature viewer and the spectral signature panel.

For details about Spectral Signature Viewer functionality, refer to Working with the Spectral Signature Viewer and Pane.
The Spectral Signature Pane is presented below.

Work with spectral libraries
Working with spectral libraries greatly expands the analytical capabilities of remotely sensed imagery. By linking image data to known spectral signatures, analysts can more precisely identify features and materials, enabling a more quantitative approach. A spectral signature provides a baseline reference for each material, against which deviations can be detected, related, and measured using remote sensing tools and techniques. These deviations allow you to assess the effects of atmospheric conditions—such as aerosol content, scattering, and absorption—as well as physical and environmental factors that influence the spectral response of features and materials in imagery.
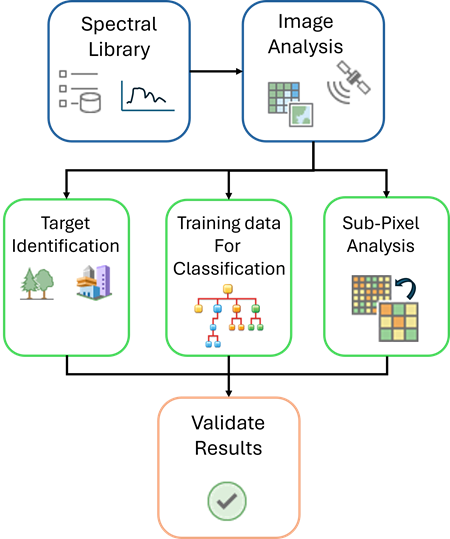
Analysts use spectral signatures in libraries for image analysis such as the following:
- Identify target materials in imagery—Spectral matching compares spectra of pixels in remotely sensed imagery with known signatures in the spectral library using techniques such as Spectral Angle Mapper (SAM), Spectral Information Divergence (SID), Normalized Spectral Similarity (NS3), and other measures. See the Detect Target Using Spectra geoprocessing tool for more details.
- Training data for classification—Spectral libraries serve as reference datasets to help train supervised classifiers. They provide ground truth spectra when direct field measurements are unavailable.
- Spectral unmixing and subpixel analysis—Material spectra help analysts perform spectral unmixing, estimating the fractional abundance of different materials in each pixel.
- Validation of results—Spectral libraries are used to validate classification results, verifying identified materials match expected spectral responses.

Spectral signature libraries are particularly beneficial when selecting image training data for classification and deep learning object detection. Training data derived from spectral signatures tends to be purer compared to data collected through traditional image interpretation methods. This purity is crucial detect specific target materials, objects, and features from imagery. Training samples can be compared and verified manually with the spectral library signatures in a library. You can collect spectral signatures of target features directly from the imagery and relate them to spectral signatures to identify and classify materials and features in the image.
As mentioned above, the ability to visualize, measure, and analyze the spectra of materials within a spectral library using a browser and viewer provides many options for image analysis. Additionally, you can identify and save selected spectral signatures, allowing you to build custom libraries of material spectra. These tailored libraries can be designed for various applications and projects, and they are fully supported by ArcGIS image analysis tools, raster functions, and workflow wizards. The spectral library files (.esl and .sli), including the spectral libraries you create and save, can be used in spectral analysis tools that use spectral library input such as Detect Target Using Spectra, Linear Spectral Unmixing, and Resample Library Spectra.