The geodatabase allows you to model real-world features as tables, feature classes, and relationships, and add behavior through geodatabase logic (domains, contingent values, attribute rules, and so on). Part of defining a geodatabase is creating the schema. In relational databases, the schema comprises a collection of tables. You can think of the schema as the blueprint of the database and, similarly, the geodatabase. Datasets and their definitions, rules, and relationships in a geodatabase define the geodatabase schema. One way to visualize your schema is to generate a schema report.
Schema report
The Generate Schema Report geoprocessing tool generates a readable Excel, JSON, PDF, HTML, or Dynamic HTML report detailing how the geodatabase schema is defined. It can be used as a way to visualize and explore your data model, as a data dictionary, or as the foundation for a more detailed document.
Watch this short video for a general overview of working with the schema report.
Use cases
It's important to understand how your schema report fits into your workflow. The following are examples:
- Documentation
- Documenting the schema allows for both GIS and non-GIS staff to understand the data and how it relates to other data in their data model. For example, as part of the onboarding process, the schema report can be used as a resource to show a non-GIS user how their business process workflows contribute to the larger department data collection story.
- Collaboration and data modeling
- Designing the schema is one of the most important first steps. The geodatabase schema report allows you to make changes to the geodatabase and export the report for collaboration purposes. For example, a new department was created to collect water and waste-water data, and two groups have started to build out the data model. However, there are differences between the two data models. The schema report can be used as a collaboration method to align the differences.
- Reporting and stakeholder buy-in
- The schema report includes different types of outputs that can be sent to stakeholders to gather support. For example, a senior level executive has asked to see a report on the proposed data model changes and how the changes help address climate change concerns in their area of interest. As part of gathering stakeholder support, the schema report can be used to present how the data model is organized and how proposed changes can offer favorable outcomes.
- Data migration
- The schema report can be used in data migration efforts. Using two schema reports, you can compare the schema after migrating the data to the destination by ensuring that the source and target reports match. For example, you are migrating an enterprise geodatabase from one DBMS provider to another. Using the schema report from the source geodatabase, you can compare the destination schema report to the origin schema report to confirm that the data migration was successful.
- Auditing and compliance
- The schema report can be used as a point-in-time report of the geodatabase schema. This is helpful for auditing and compliance purposes when there are legal requirements around data retention records. For example, your department is required to have yearly records going back several years. You can use the geodatabase schema report to assist in the data retention record requirements. By capturing snapshots, you can see how the geodatabase has changed over time and when consequential schema changes were made.
Report format
The Generate Schema Report geoprocessing tool allows you to select a target destination folder and generate a readable Excel XLSX, JSON, PDF, HTML, or Dynamic HTML representation of the geodatabase schema.
Excel
The following is an example of an Excel workbook generated from address data in a geodatabase. The table of contents (TOC) tab provides an overview of the information included in the report. To quickly navigate to other sections of the workbook, you can click the hyperlinked text or use the worksheet tabs along the bottom.

Dynamic HTML
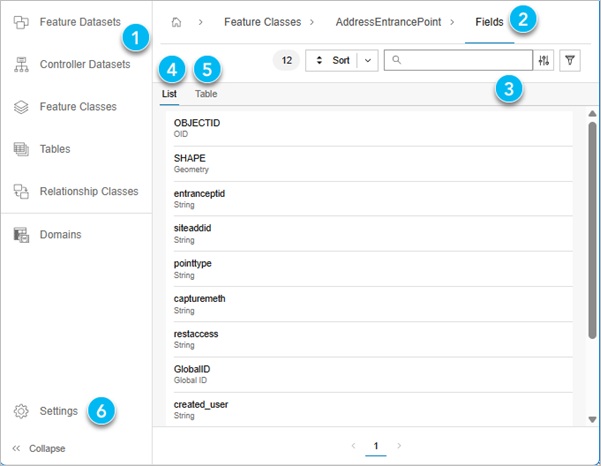
Dynamic HTML is another supported format and allows navigation through a browser. There are two ways to view the information: list view and table view. List view is for quick navigation, and table view allows you to see all of the properties. An example of Dynamic HTML is shown below:

The following table correlates the numbers in the image above from the list view with its corresponding element number and description.
| Element | Description |
|---|---|
1 | The navigation bar displays geodatabase objects like datasets and geodatabase functionality such as domains. |
2 |
The breadcrumb trail indicates the relationship between the hierarchy of the schema report and the information displayed in the content view (table or list view). |
3 | Sort, search, and filter tools allow you to locate information quickly and efficiently. |
4 |
List view displays information in the content view to quickly scan. |
5 |
Table view displays information in the content view so you can see all of the common properties. |
6 |
Settings control the display of system properties throughout the entire report. |
Create a schema report
To generate a schema report, complete the following steps:
- In the Catalog pane, right-click the table, feature class, feature dataset, or geodatabase you want to use as the input to the Generate Schema Report geoprocessing tool.
- Click Export.
- Click Generate Schema Report.
- In the Generate Schema Report geoprocessing tool, fill in the remaining parameters, select the desired output formats, and click Run.
The selected reports are generated in the specified output location.
Read the Geodatabase Schema Reports blog article for more tips and tricks when working with the schema report.
Compare schemas
Another important activity of data modeling includes comparing schemas, such as in the following scenarios.
Schema comparison use cases
It's important to understand how comparing your schemas fits into your workflow. The following are examples:
Migrating data
When migrating enterprise geodatabase data from one database provider to another, schema comparison can be used to ensure that all feature classes and tables exist in both environments, naming conventions match, and data types match. Schema comparison is also helpful for ensuring that datasets are not lost and configuration issues are identified during migration.
Comparing environments
Organizations may have multiple environments representing production, test, and development. When pushing changes from one environment to another, schema comparison can be used to ensure that the intended outcomes are synced between the environments.
Version control
Version control involves tracking schema changes at specific instances for a given state of your schema. Schema reports can be used to compare an expected schema version across environments and versions to visualize changes made or required.
Auditing and compliance
For regulated industries, the schema comparison report can be used as a part of auditing activities and prove that no unauthorized schema modifications occurred.
Troubleshooting issues
Sometimes errors stem from schema differences, which could include mismatched data types, incorrect dataset numbers or names, missing fields, and so on. Generating a schema comparison can quickly identify how the two schemas differ.
Schema comparison output
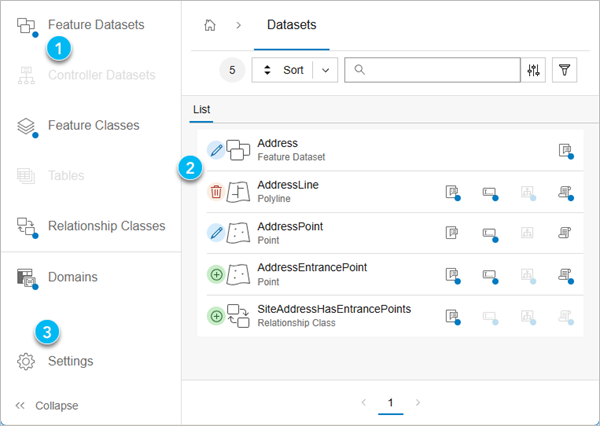
The schema comparison report is created using the compare schemas geoprocessing tool and has the same look and feel as the Dynamic HTML report output with a few noticeable changes. By default Show Differences Only is turned on. An example of the list view of the schema comparison report is listed below:

The following table correlates the numbers in the image above from the list view with its corresponding element number and description.
| Element | Description |
|---|---|
1 | Blue dots indicate differences in the report. |
2 | Insert, update, and delete icons indicate the type of change. Updates may comprise an insert, update, and delete depending on the hierarchy level in the content view. |
3 | Settings control the display of system properties and visualizing differences only. |
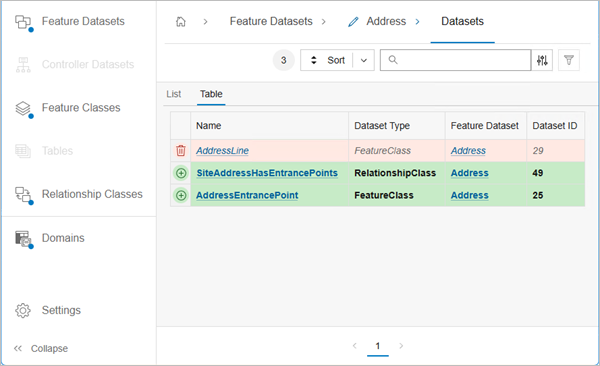
An example of the table view of the schema comparison report is listed below:

Create a schema comparison report
To generate a schema comparison report, complete the following steps:
- Open the compare schema geoprocessing tool within the Data Management toolbox.
- Set the following parameters:
- Set the base source as the geodatabase or schema report that you will use as your starting state for comparison.
- Set the test source as the geodatabase or schema report that you will use as your end state for comparison.
- Set the output location, type the name of the file, and ensure that the format for Dynamic HTML is checked.
- Run the tool to generate a Dynamic HTML output.
Make schema changes in the schema report
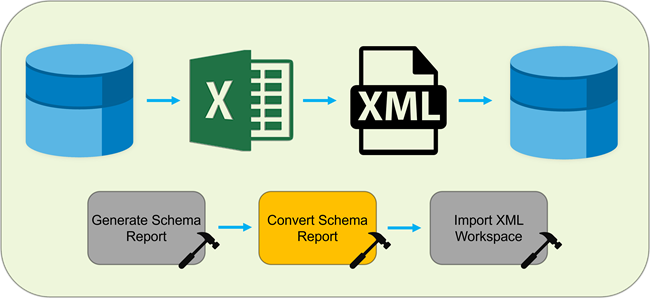
A common workflow is to export the schema report to an Excel workbook and then perform schema changes within Excel. This offers an alternative to opening up and working in multiple Design views (Fields, Domains, Subtypes, and so on) to make schema changes and can often times be a faster and more productive workflow when mass schema changes are needed.
The short video below offers a quick overview of the workflow.
The following steps outline the workflow and geoprocessing tools used, which can be applied to any number of data modeling tasks.
- Generate a schema report and export it to an .xlsx or .json file.
- Open the Excel workbook or JSON document and make schema changes.
- Convert the schema report from its original format to an .xml file.
- Create a geodatabase from the Catalog pane, a catalog view, or a geoprocessing tool.
- Import the XML workspace document containing the schema changes to the new geodatabase.

For more information on making changes in the schema report, read the Edit schema reports for conversion blog article.
Tips for editing schema reports
Keep the following in mind when editing schema reports:
It is important to have an intimate understanding of your schema before making changes to it in this manner. There is very limited validation logic associated with this process, and any errors due to user input in the .xlsx file could result in broken schema elements when the new geodatabase is created. A schema report is not a geodatabase and cannot validate whether edits you make will be successful. The report can't validate against a destination workspace, identify dependencies, or check against rules or constraints imposed by your organization. For these reasons, it's important to always edit carefully, know the limitations of your destination workspace, and always edit a copy of your original schema report.
Only schema changes made on the individual sheets for any given schema element will be converted from .xlsx to .xml during this process. For example, if you want to change the order of fields for a feature class or update its spatial reference, you must browse to the worksheet for that feature class in the Microsoft Excel workbook and make the changes there. Making the update on the FeatureClass worksheet containing all of the feature classes in the schema report will not have any effect.
- When adding brand new rows to existing tables in the report, make sure that each cell in the rows you add has a value. When in doubt, check out similar tables in another worksheet for examples to ensure sufficient schema information.
- Some edits will not apply when converting a schema report to a geodatabase, like scale or precision values for fields when importing to a file geodatabase. System-maintained fields—like OBJECTID, and some fields required by controller datasets, such as utility networks—will not reflect changes made in the schema report.
