The Reduce Junction rule is used to simplify the diagram graph while preserving the topology.
The Reduce Junction rule reduces specific junctions represented in diagrams. This rule processes on network junction classes or object tables, or on network categories. When the reduce operation is configured to process on a network source class or object table, you can filter out the junctions to reduce by attributes. The reduction always applies to the number of junctions to which the junction connects and optionally, to specific attribute values or attributes from adjacent edges.
Reduce Junction rule process
Whether the junctions to reduce are based on network junction classes or object tables, or on network categories, the reduction process is the same and behaves according to the valence of the junctions. There are clear differences in the treatment of junctions that connect two other junctions or fewer versus junctions that connect three other junctions or more. These differences are detailed in the following sections.
Reducing junctions connecting two other junctions or fewer
When reducing junctions that connect two other junctions or fewer, the Reduce Junction rule process runs as follows:
- Any unconnected junction is removed.
- Any junction that connects a single junction and its connected edges are reduced onto that other junction, which is considered the target junction.
- Any junction that connects two other junctions and all its connected edges are reduced onto a super span edge, called a reduction edge, which is created for the reduction.
Reducing junctions connecting three other junctions or more
When reducing junctions that connect three other junctions or more, the Reduce Junction rule process depends on the tier definition of the network; that is, a junction existing in a partitioned network is not reduced in the same way as in a hierarchical network.
In a network with a hierarchical tier definition, the junction to reduce is aggregated to any other junction to which it is connected except a leaf junction. When any junctions to which it connects are leaf junctions, it is not reduced.
In a network with a partitioned tier definition, any junction that connects a single upstream junction is reduced onto this upstream target junction. When there is no junction that is upstream to the junction to reduce or there are multiple junctions that are upstream to the junction to reduce, the same analysis operates on the downstream direction. The process searches for a single downstream junction and reduces onto that downstream target junction when it exists. When there is no single upstream junction nor single downstream junction, the junction to reduce is not reduced.
Note:
Starting with ArcGIS Pro 3.4, the rule can be configured to consider flow direction based on the digitized direction when searching for the targeted upstream or downstream junction. In earlier ArcGIS Pro versions, the upstream and downstream trace operations could only consider flow direction based on the subnetwork controller locations.
Connection changes and association reports when reducing junctions
When reducing junctions, there are a few things to note:
- There are some cases in which reducing junctions changes the number of edges connecting the junctions that remain in the diagram.
- Except when reducing unconnected junctions, it keeps track of any reduced junction and its connected edges either on the diagram junction that is considered the target junction by the reduction rule or on the reduction edge, which is created by the rule.
The following diagrams show examples of the connection changes and association reports.
Diagram A—Reduce junctions connected to one other junction
Diagrams A1 and A2 in the first row of the table below show two diagrams before reduction. Each one shows the diagram content before the orange junction with one connected junction is reduced.
| Diagram A1—Graph changes and association reports | Diagram A2—Graph changes and association reports |
|---|---|
 |  |
 |  |
The diagrams after reducing the orange junction are shown in the second row of the table. After reduction, J2 and its connected edges are no longer visible in the resulting diagrams, but the rule kept track of these network elements. They are now associated with the target J1 junction.
As shown in the examples, reducing junctions that connect one other junction does the following:
- Changes the number of connections of the target junctions—J1 connected one junction before reduction and becomes unconnected after reduction. In general, when the target junction connects N junctions before reduction, it connects N-1 junctions after reduction.
- Causes all the reduced network elements to be reported on the other target junction.
Diagram B—Reduce junctions connected to two other junctions
The following diagrams show how reduce junctions connected to two other junctions are reduced.
General case
Diagrams B1 and B2 in the first row of the table below show the two diagrams before reduction. Each one shows the diagram content before the orange junction with two connected junctions is reduced.
| Diagram B1—Graph changes and association reports | Diagram B2—Graph changes and association reports |
|---|---|
 |  |
 |  |
The diagrams after reducing the orange junction are shown in the second row of the table. After reduction, J2 and all its connected edges are no longer visible in the resulting diagrams, but the rule kept track of these network elements. They are now associated with the dashed blue reduction edge created during the rule process.
As the examples show, reducing junctions connecting two other junctions does the following:
- Leaves the number of connected junctions unchanged for those two other junctions
- Causes the reduced junction and all its adjacent edges to be reported on the reduction edge, which is created by the rule
Reduce junctions along complex edges
When reducing junctions connected to two other junctions along a complex edge—that is, junctions that connect two segments along the same complex edge—the rule behavior is slightly different. In this case, note the following differences:
- No reduction edge is created.
- One of the complex edge segments is preserved to keep relevant information in the resulting diagram.
- All the reduced junctions are reported on this edge.
 |
 |
Diagram B3 in the first row shows the diagram before reduction. It references two complex edges, E1 and E2, composed of different segments, each segment connected to orange junctions.
After reducing the orange junctions, each complex edge is represented by a single segment that aggregates all the orange junctions along the segment.
Reduce junctions connected to three other junctions or more
The following sections explain how the reduction process runs in a network with a hierarchical tier definition versus in a network with a partitioned tier definition.
Diagram C—Reduce junctions connected to three other junctions or more in a network with a hierarchical tier definition
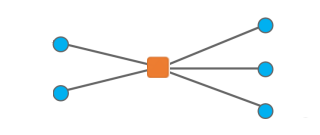
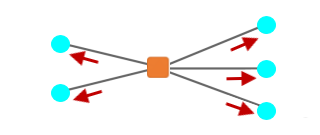
Diagrams C1 and C2 in the first row of the table below show two diagrams before reduction. Each one shows the diagram content before the orange junction is reduced.
| Diagram C1—Process | Diagram C2—Process |
|---|---|
 |  |
 |  |
 |  |
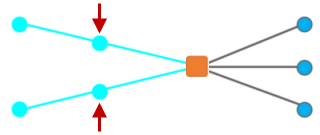
In the second row, each graphic highlights the junctions connected to the orange junction to reduce. For Diagram C1, the two junctions at the left of the orange junction can be used as the target junction onto which that junction can be reduced, while the three junctions at the right cannot be since they are leaf junctions. For Diagram C2, any junctions connecting the orange junction to reduce are leaf junctions and so cannot be used as any target junction onto which the orange junction can be reduced.
The sample diagrams' content after the reduction is shown in the third row of the table. In Diagram C1, the orange junction is effectively reduced to one or the other of the junctions that was at the left of the orange junction. In Diagram C2, the orange junction is not reduced.
The next table shows how the diagram graph changes and how associations are reported when a junction that connects three other junctions or more is effectively reduced in a network with a hierarchical tier definition.
| Diagram C3—Graph changes and association reports | Diagram C4—Graph changes and association reports |
|---|---|
 |  |
 | 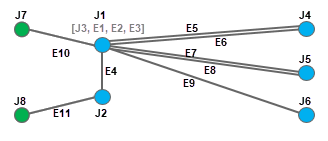 |
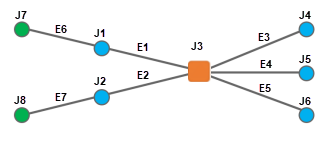
Diagrams C3 and C4 in the first row show the diagrams before the orange junction, which connects five other junctions, is reduced.
The diagrams obtained after reducing this orange junction are shown in the second row:
- For Diagram C3 on the left, J3 and E1 are no longer visible after reduction.
- For Diagram C4 on the right, J3, E1, E2, and E3 are no longer visible after reduction.
In both cases, the reduction rule kept track of those network elements. They are now associated with the target junction, J1. Moreover, J3, which connected N=5 junctions, is reduced to J1, which connected M=2 junctions before reduction, then connects M=5 junctions after reduction.
Diagram D—Reduce junctions connected to three other junctions or more in a network with a partitioned tier definition
Diagrams D1 and D2 in the first row of the table below represent portions of a network with a partitioned tier definition. They show the initial content of two diagrams before reducing any orange junction that connects three other junctions or more.
| Diagram D1—Process | Diagram D2—Process |
|---|---|
 |  |
 |  |
 |  |
In the second row, each graphic shows the result of the upstream trace (or downstream trace) started from the junction to reduce—that is, started from the orange junction—in Diagrams D1 and D2. For Diagram D1, the trace returns only one upstream junction (or downstream junction), while for Diagram D2, it returns more than one upstream junction (or downstream junction).
The sample diagrams' content after the reduction is shown in the third row of the table. In Diagram D1, the orange junction is effectively reduced, its upstream or downstream junction becoming the target junction for the reduction. In Diagram D2, the orange junction is not reduced.
The next table shows how the diagram graph changes and how associations are reported when junctions that connect three other junctions or more are reduced.
| Diagram D3—Graph changes and association reports | Diagram D4—Graph changes and association reports |
|---|---|
 |  |
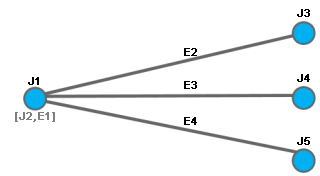 |  |
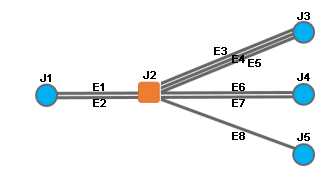
Diagrams D3 and D4 in the first row show the diagrams before the orange junction, which connects four other junctions, is reduced.
The diagrams obtained after reducing this orange junction are shown in the second row:
- For Diagram C3 on the left, J2 and E1 are no longer visible after reduction.
- For Diagram C4 on the right, J2, E1, and E2 are no longer visible after reduction.
In both cases, the reduction rule kept track of those network elements. They are now associated with the target junction, J1, which was upstream or downstream to J2. Moreover, J2, which connected N=4 junctions, is reduced to J1, which connected M=1 junctions before reduction and connects M=3 junctions after reduction.
As the examples show, reducing a junction J2 connecting N = three other junctions or more does the following when that junction has only one upstream (or downstream) junction, J1, connecting M junctions:
- Changes the number of connections of the J1 upstream junction so it connects N+M-2 junctions after reduction
- Causes the reduced junction and all its adjacent upstream (or downstream) edges to be reported on the target upstream (or downstream) junction
Junction reduction and containment
The Reduce Junction rule obeys the following rules:
- A content junction can never aggregate noncontent features.
The examples below show different use cases. The first column shows sample diagrams with a blue content junction connected to orange junctions. The second column shows the diagram after running a Reduce Junction rule that is set up to reduce all the orange junctions.
In Diagram 1, no network element is reduced, since the blue content junction cannot aggregate the orange noncontent junction.
Diagram D1 is shown before reducing the orange junctions. 
Diagram D1 is shown after reducing the orange junctions. In Diagram 2, only the orange junction on the left and its connected edge are reduced to the blue one, which is a content junction like them.
Diagram D2 is shown before reducing the orange junctions. 
Diagram D2 is shown after reducing the orange junctions. In Diagram 3, the orange junctions on the left and their connected edge are reduced to the blue junction, which is a content junction like them. The orange noncontent J9 junction and its two connected edges are aggregated under a reduction edge.
Diagram D3 is shown before reducing the orange junctions. 
Diagram D3 is shown after reducing the orange junctions. - A noncontent junction can never aggregate content features or objects. However, the resulting reduction edges can aggregate both noncontent and content elements.
The examples below show some use cases. The first column shows sample diagrams with a blue noncontent junction connected to orange junctions. The second column shows the diagram after running a Reduce Junction rule that is set up to reduce all the orange junctions.
In Diagram 4, no network element is reduced, since the blue noncontent junction cannot aggregate the orange content junction.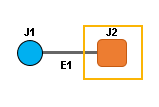
Diagram D4 is shown before reducing the orange junctions. 
Diagram D4 is shown after reducing the orange junctions. In Diagram 5, J4 and E3 are contents that are reduced under the content junction J5. E2 is aggregated under a reduction edge R1 that connects the noncontent junction J3 to the content junction J5.
Diagram D5 is shown before reducing the orange junctions. 
Diagram D5 is shown after reducing the orange junctions. In Diagram 6, the orange junction J6 on the left and its connected edge E4 are reduced to the blue junction, which is noncontent like them. J8 and E6 on the right are contents that are reduced under the content junction J9. E5 is aggregated under a reduction edge R2 that connects the noncontent junction J7 to the content junction J9.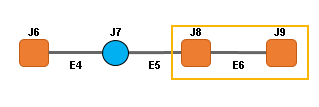
Diagram D6 is shown before reducing the orange junctions. 
Diagram D6 is shown after reducing the orange junctions.
Reduce Junction rule configuration
The tools to use to add a Reduce Junction rule on a template—Add Reduce Junction Rule, Add Reduce Junction By Attribute Rule, and Add Reduce Junction By Category Rule—are described as follows::
- Use the Add Reduce Junction Rule tool to configure the reduction of diagram junctions based on particular network junction source classes or object tables. It allows you to specify a list of junction source classes and object tables and to consider each junction belonging to those junction classes and object tables as a candidate for the reduction or to consider any junctions out of the specified junction classes and object tables as candidates for the reduction. Then, all junctions that are candidates for the reduction are processed according to the number of junctions they connect in the diagram and, optionally, according to attributes brought by their incident edges.
- Use the Add Reduce Junction By Attribute Rule tool to configure the reduction of diagram junctions based on one particular network junction source class or object table by filtering those junctions on their own attributes. Then, all junctions that are candidates for the reduction are processed according to the number of junctions they connect in the diagram and, optionally, according to attributes brought by their adjacent edges.
- Use the Add Reduce Junction By Category Rule tool to configure the reduction of junctions tagged with or without particular network categories.
Note:
The Add Reduce Junction By Category Rule tool only applies to Utility Network Version 7 and later.
Tip:
When configuring diagram rule by attributes, you can filter out diagram features on network source attribute values regarding the other diagram feature attribute values using the following specific SQL statement: WHERE 'OBJECT' = 'IN_DIAGRAM'. For example, to query the diagram feature with a minimum attribute value in the generated diagram, you can set up any Add <XXX> By Attribute Rule tool with an SQL expression based on the following syntax: <attributeName> = (SELECT MIN(<attributeName>) FROM <networkClassName>) WHERE 'OBJECT' = 'IN_DIAGRAM'.