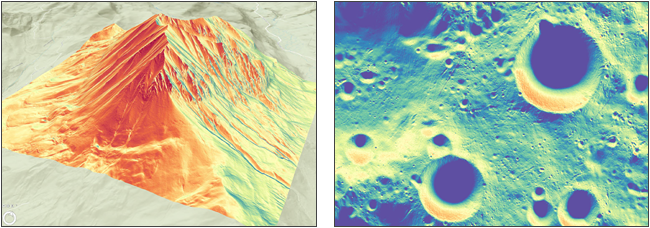
Available with Spatial Analyst license.
Solar radiation, also known as solar insolation, is a fundamental concept in solar energy and meteorology. It refers to the electromagnetic radiation emitted by the Sun, encompassing a broad spectrum of wavelengths that includes ultraviolet, visible, and infrared light. By quantifying and analyzing solar radiation data, you can optimize the design and performance of solar energy systems, optimize agriculture seed selection and irrigation, predict snow melt and runoff, understand wildfire risk, and identify optimal locations for specific plants, animals, or development.
Incoming solar radiation originates from the Sun, passes through the atmosphere, and is received at the Earth's surface as direct, diffuse, and reflected components. Direct radiation is that which is intercepted unimpeded in a direct line from the Sun. Diffuse radiation is scattered by atmospheric constituents such as clouds and dust. Reflected radiation is that which bounces back from a surface in another direction. The sum of the direct, diffuse, and reflected radiation is called total or global solar radiation. The solar radiation tools do not include reflected radiation in the calculation of total radiation. Therefore, the total radiation is calculated as the sum of the direct and diffuse radiation.
For the Raster Solar Radiation and Feature Solar Radiation tools, the general logic for analysis for each location (cell) follows:
- Compute the sky map for diffuse radiation.
- Compute the sun maps for direct radiation.
- Compute the hemispherical viewshed to represent the visible sky.
- Overlay the viewshed with sky map and sun map to determine the portion of visible sky to calculate diffuse, direct, and total radiation.
- Repeat for every location to produce an insolation raster map or feature data.
See Modeling solar radiation for more information on the calculation of sky map, sun map, and viewshed.
Learn more about how Feature Solar Radiation works
Learn more about how Raster Solar Radiation works
Sun map computation
For the Raster Solar Radiation and Feature Solar Radiation tools, many sun maps are created during analysis. This provides the ability to model larger analysis areas by more accurately modeling the Sun’s position across the landscape as the angles of the Sun change with latitude and longitude.
Direct solar radiation originating from all directions in the sky is calculated using a sun map in the same hemispherical projection as the viewshed. A sun map is a raster representation that displays the apparent position of the Sun as it varies through the hours of day and through the days of the year. This is like you observing as the Sun's position moves across the sky over time.
The sun map consists of discrete sectors defined by the Sun's position for each day using the time interval of 0.5 hours for the Earth and 2 Coordinated Universal Time (UTC) hours for the Moon. The interval is bigger for the Moon because the lunar day is much longer than an Earth day. Each sector of the sun map gets a unique identifier along with the zenith and azimuth (elevation) angles at its centroid are calculated. The sun map is computed each day and the amount of solar radiation originating from each sector is calculated separately. The viewshed is then overlaid with the sun maps for calculation of direct radiation from each sector.
The sun map changes with location according to the longitude, latitude, and altitude. Ideally a sun map would be calculated for each pixel of the input surface. However, for efficiency, one sun map is applied to a group of adjacent pixels of the input surface. Sun maps are computed as a mesh of hexagonal tiles using the H3 geospatial indexing system.
Learn more about the H3 discrete global grid at https://h3geo.org/.
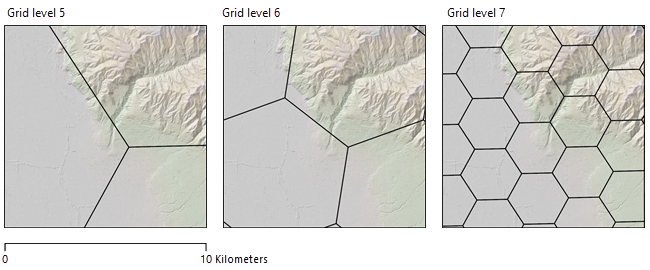
The relative size of the sun map areas is controlled by the Sun Map Grid Level parameter. This parameter controls the speed and accuracy of the computation. It adjusts the resolution of the hexagonal grid cells that will be used for the internal calculations. The image below shows how sun maps are applied for grid levels 5 to 7 for the same area on Earth. All cells of the input surface raster that fall within each hexagon grid will have the same sun map values applied.

A lower grid level creates fewer larger sun map areas and decreases tool run time. A higher grid level creates many more, smaller sun maps, improving the accuracy of the result. A larger sun map will generalize the values for the Sun’s position across the entire area of the sun map grid. This means the same values for the sun angles and elevation will be the same at the extremes. Conversely, to analyze the Sun’s position more accurately across the landscape, you would use the highest grid levels.
The following table shows the average area of the hexagon grid cells for each sun map level, in units of square kilometers:
| Level | Earth | Moon |
|---|---|---|
4 | Not applicable | 131.6 |
5 | 252.9 (default > 4m) | 18.8 |
6 | 36.1 (default < 4m) | 2.69 (default) |
7 | 5.16 | Not applicable |
Calculate solar radiation for the Earth and Moon
The incoming solar radiation received from the Sun is the primary energy source that drives many of the Earth's physical and biological processes. Understanding its importance on landscape scales is key to understanding a broad range of Earth’s natural processes and human activities.

The solar radiation analysis for the Moon and the Earth are calculated in the same way. However, there are physical and temporal differences to account for. For example, the length of a lunar day is about 29.5 Earth days. On the Moon, there is no atmosphere, so diffusion radiation will not be calculated. As a result, the total radiation is equal to direct radiation. For Moon computations, time is defined in Coordinated Universal Time (UTC) as the time zones used on Earth do not make sense for the Moon. For interval calculations, the minimum time duration is 0.5 hours for the Earth and 2 hours for the Moon.
Analysis on the Moon
The ability to analyze solar radiation on the Moon is important for planetary science and to organizations such as NASA JPL. The following are some of the applications:
- The study of lunar surface geology and thermal analyses
- Research into potential ice deposits in areas which receive little to no light, known as permanently shadowed regions (PSR)
- Input for navigation and route planning for solar-powered autonomous vehicles
- Optimal siting analysis for eventual solar-powered lunar facilities
To get started, lunar data can be found from Moon Trek, an application supported by NASA JPL that allows you to view and download many different lunar data products.
Learn more about Moon Trek at the NASA website https://trek.nasa.gov/moon.
Use of a GPU
The Raster Solar Radiation and Feature Solar Radiation tools can deliver increased performance if you have certain GPU hardware installed on your system. Otherwise, the analysis will be processed fully on the CPU. Running the tools with a compatible GPU is significantly faster than the CPU. For processing on the CPU, these tools will take advantage of all available processing cores for additional performance gains. Use the Target Device for Analysis parameter to control whether the GPU or CPU will be used to run the tool.
See GPU processing with Spatial Analyst for details on compatible GPUs, configuring and working with GPU devices, as well as troubleshooting tips.
Integration with SPICE API
The solar radiation tools use the NASA SPICE software to determine the relative positions in space and time of the Sun, Earth, and Moon. The primary SPICE data sets are called kernels. Kernel data are composed of navigation and other ancillary information providing precision observation geometry for celestial bodies. These data are included as part of the installation of ArcGIS Pro. Esri will update the kernels with the latest version that is available at the time of release. Updating or adding additional kernel files is not supported by the user.
SPICE is not used to calculate solar insolation directly.
Learn more about SPICE at the Navigation and Ancillary Information Facility at the NASA JPL website https://naif.jpl.nasa.gov/naif/.
Additional resources
Acton, Charles A. 1996. "Ancillary data services of NASA's Navigation and Ancillary Information Facility." Planetary and Space Science Volume 44, Issue 1, January 1996, pp. 65–70. https://doi.org/10.1016/0032-0633(95)00107-7
Acton, Charles, Nathaniel Bachman, Boris Semenov, and Edward Wright. 2018. "A look towards the future in the handling of space science mission geometry." Planetary and Space Science Volume 150, January 2018, pp. 9–12. https://doi.org/10.1016/j.pss.2017.02.013
Brodsky, Isaac. 2018. "Uber’s Hexagonal Hierarchical Spatial Index H3." Engineering (blog), June 27, 2018. https://www.uber.com/blog/h3/