Available with Spatial Analyst license.
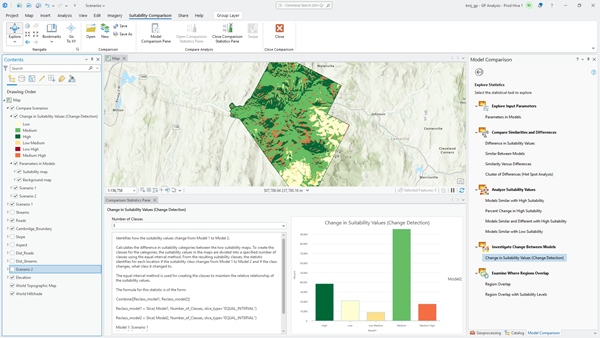
The Comparison Statistics Pane is an additional pane to display the results of the predefined statistic selected in the Explore Statistics pane.
The result when the Run button is clicked is as follows:
- The Explore Statistics pane and Comparison Statistics Pane appear.
- The results from the first statistic set in the Explore Statistics pane are displayed.
- The output map is shown.

The Comparison Statistics Pane is updated with each selected statistic. Generally, the pane for each statistic follows a similar pattern except for the Parameters in Models statistic.
The Comparison Statistics Pane for the Parameters in Models statistic has two tabs. On the first tab, you can display the suitability and regions map and see the parameters for each model. On the second tab, you can examine the applied transformations for the criterion side by side. When the input to the comparison model are submodels, the second tab is unavailable.
The Comparison Statistics Pane for the remaining statistics follow the patterns listed below:
- The parameters for the statistic are available.
- The parameters are populated with default values.
- The statistic is recalculated when the parameter values are changed.
- Analytical descriptive text provides summary information of the statistic and the resulting output.
- There is a resultant plot or table from the statistic.