Available with Spatial Analyst license.
The Model Comparison interface is an interactive environment that allows you to compare multiple Suitability Modeler models relative to one another. By comparing suitability models, you will gain an understanding of how applying different parameters spatially affects the results.
Generally, transformations and weights are assigned based on expert opinion. As a result, when comparing the models, there is no single statistic that indicates which model is better. The Model Comparison interface uses a series of statistics to identify where multiple models are similar and where they are different.
As a result of a model comparison, you can choose to implement one of the models, or you can alter the models to obtain the desired results.
Reasons to compare models
Ideally, the models you are comparing have the same subject and are in the same study area, though any models can be compared. One of the more powerful applications of the Model Comparison interface is to explore different scenarios between the models and apply what-if scenarios.
You can use the Model Comparison interface to see how changing the parameters in the models affects the subject's interaction with its environment and the spatial relationships in the output. You can see how much influence the changes have. Do the suitability values increase or decrease? Are the changes minor or substantial? Are the changes clustered? Do the areas identified as highly suitable remain the same? Or do they shift to new locations in the study area? Identifying these spatial patterns helps you understand whether the change of parameters in the models leads to meaningful differences in the results.
By changing certain input and model parameters within and between the models, the scenarios that you can explore include the following:
- Investigate the impacts of modifying the objectives of various submodels.
For example, in a suitability model for locating a solar farm, policy makers can see the implications if more importance is placed on the environmental submodel over the cost of construction submodel.
- Understand the effects of changing the weights on the criteria within one of the models.
You may need to determine if the subject's response to the criterion was captured correctly. For example, experts want to re-evaluate the importance of land use to bobcat populations. By changing the weights on land use, you can determine how significant this debate is.
Or you may explore if the subject changes its responses to the criterion based on circumstances. You can determine what will happen if steeper slopes become more important for safety to bobcat populations if there is an increase in the area's human population.
- Determine if you have captured how the subject is responding to the criteria values by altering the transformations.
For instance, you know distance to electrical lines is important for choosing where to build a corporate headquarters. You applied the MSSmall function. You want to determine if the transformation correctly captures the costs associated with getting the power to a proposed site and how sensitive the results are to the choice of the transformation.
- Inquire if you have the correct criteria to capture what the subject is responding to.
Does the output from the solar radiation tools or aspect capture a winery's needs for solar gain? Or does it matter?
Through the Model Comparison interface, you can see the impact of selecting one model over another, which areas are impacted, and how significant that impact is.
As a result, stakeholders can examine the consequences of decisions made in various models and analyze how they will affect what is being proposed. The interface guides the decision maker whether to choose between models or if they should try other scenarios.
Model Comparison interface
The core of the model comparison analysis involves the application of a set of predetermined statistics and the examination of the results. The statistics allow you to analyze the spatial distribution of the similarities and differences between the models, how the suitability values change between the models, and where there is agreement in the locations of the final sites.
The Model Comparison interface is composed of three interacting panes:
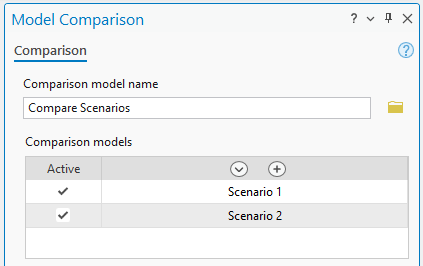
- The Comparison pane is used to name the model, identify the models to compare, set if the models should be normalized or not, and select the predefined statistics you wish to run.
- The Explore Statistics pane is activated once the predefined statistics have been run from the Comparison pane. On the pane, you select the predefined statistics you wish to view and explore.
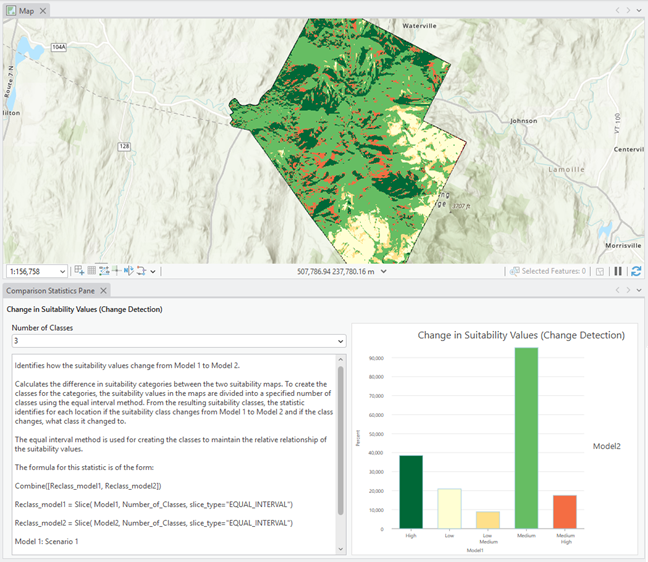
- The Comparison Statistics Pane appears when a statistic is selected in the Explore Statistics pane. The pane displays the parameters for the statistic, plots of the statistical results, and interpretive text. The resulting map from the statistic is displayed in the map. You can change the parameters to explore the statistic in more depth.
Predefined statistical groups
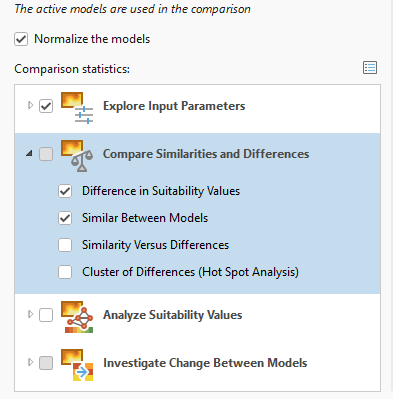
There are 13 predefined statistics that help you compare the input models. The statistics are grouped into five functional areas to address different aspects of the model comparison.
- Explore Input Parameters contains one statistic that provides an overview of the model parameters and the output. In addition, you can see the transformed criteria plots displayed side by side.
- Compare Similarities and Differences has a series of statistics that allow you to see where the suitability values between the models are similar and where they differ.
- Analyze Suitability Values contains various statistics for you to analyze the spatial distribution of the high suitability values between the models. The high suitability values are the most critical to the model output.
- Investigate Change Between Models includes a number of statistics to identify how the suitable categories change between the models.
- Examine Where Regions Overlap is composed of two statistics that allow you to analyze where the models' final locations are in agreement and where they differ.
Compare models
To compare models, complete the following steps:
- Open the Comparison interface by doing one of the following:
- On the Pro Analysis toolbar, on the Suitability Modeler drop-down menu, click Comparison model.

- In Catalog, right-click a comparison model container (identified by the .sac extension) in a Spatial Analyst container and click Comparison Model.
- On the Pro Analysis toolbar, on the Suitability Modeler drop-down menu, click Comparison model.
- In the Comparison pane, name the comparison model.
- In the Comparison models parameter, select the models you want to compare.
- Check the models that will be active in the comparison.
At least two models must be active.

- Check the models that will be active in the comparison.
- Determine if the models should be normalized (put on a 1 to 100 common scale if their suitability values vary) so they can be compared. If so, click the check box next to the Normalize the models parameter.
By default, the parameter is checked.
- In the Comparison statistics list in the Comparison pane, select the predefined statistics to run.

The Difference in Suitability Values and Similar Between Models statistics have been selected to be run. - Click the Run button to generate the statistics.
The Explore Statistics pane and the Comparison Statistics Pane will appear with the first statistic in the list displayed.

- In the Explore Statistics pane, select the statistic to view and explore.
The controlling parameters, plots, statistics, and interpretive text for the statistic are displayed in the Comparison Statistics Pane.
The resulting map from the statistic is displayed in the Map view.

- In the Comparison Statistics Pane, you can alter the parameters for the statistic as desired.
The interpretive text provides both an explanation of the statistic and a formula you can use to adjust the parameters.
- Click another statistic in the Select the statistical task to explore list in the Explore Statistics pane.
Normalization
The suitability maps in the models being compared may have varying ranges of values. This generally occurs for the following reasons:
- Different weights are applied.
- There are a different number of criteria.
If you compare the similarities and differences of the absolute suitability values between the different ranges, the resulting statistics will be skewed. That is, an area can have high suitability values in both models, but their absolute values can vary greatly. As a result, your comparison will be invalid.
To compare the relative suitability values between models with different ranges, click the Normalize the models parameter check box in the main Comparison pane. It is checked by default.
The suitability values in each of the suitability maps will be linearly transformed to a 1 to 100 scale. As a result, you can then compare the suitability maps from the models relative to one another.
For all the statistics in which you specify a suitability value as a threshold, if the models have been normalized, you must specify the thresholds as normalized values that are on a 1 to 100 scale.
If you specify 50 as a high suitability threshold for a normalized suitability map, that will correspond to a suitability value of 22 if the original suitability map range was 4 to 40, and a 16.5 if the range was 3 to 30. They are the midpoints in both suitability maps.
To help you when specifying the suitability thresholds in the statistics, the normalized suitability maps from the models are automatically added to the Model Comparison group layer.
Normalization has no effect on the final regions from Locate. Even though the regions are derived from the suitability maps, their locations would not change if the suitability values are normalized.
Normalization is not necessary when the models use the same set of criteria and the same weights, but differ only in the transformation functions applied to one or more criteria. In this case, the suitability maps are still on comparable scales, and normalization is not required to interpret the differences.
Manage the comparison model
Click the Save button on the Comparison ribbon to save your comparison model.
The output rasters from the statistics are saved with unique names (ModelName_StatisticName) to the project geodatabase so they will not need to be recalculated when the model is reopened.