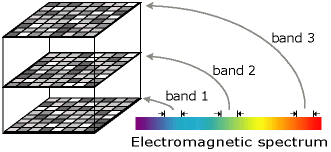
Some images have a single band, or layer (a measure of a single characteristic), of data, while others have multiple bands. A band is represented by a single matrix of pixel values, and a raster with multiple bands contains multiple spatially coincident matrices of pixel values representing the same spatial area. An example of a single-band raster dataset is a digital elevation model (DEM). Each pixel in a DEM contains only one value representing surface elevation. You can also have a single-band orthoimage, which is called a panchromatic or grayscale image. Most satellite, airborne, and drone imagery has multiple bands, typically containing values within a range or band of the electromagnetic spectrum.
There are three main ways to display (render) single-band raster datasets:
- Two colors—In a binary image, each pixel has a value of 0 or 1 and is often displayed using black and white. This type of display is often used for displaying scanned maps with simple line work, such as parcel maps.
- Grayscale—In a grayscale image, each pixel has a value from 0 to another number depending on data type, or pixel depth, such as 255 (8 bit) or 65,535 (integer). This display type is often used for panchromatic satellite images or aerial images.
- Color map—With a color map, a set of values is coded to match a defined set of red, green, and blue (RGB) values. For example, a DEM can be rendered with a color according to elevation, or the classes in a thematic map are rendered with a color map. For more information, see Color map concepts.
The following are examples of these three ways to display single-band raster datasets:


When there are multiple bands, every pixel location has more than one value associated with it. With multiple bands, each band usually represents a segment of the electromagnetic spectrum collected by a sensor. Bands can represent any portion of the electromagnetic spectrum, including ranges not visible to the eye, such as the infrared or ultraviolet sections. The term band originated from the reference to the color band on the electromagnetic spectrum, such as blue, green, red, and near-infrared.

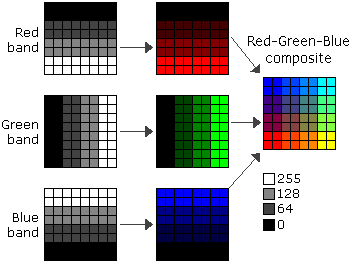
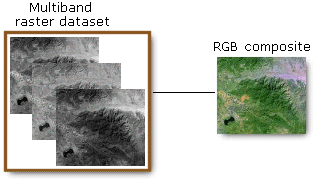
When you create a map layer from a raster image, you can display a single band of data or form a color composite from multiple bands. A combination of any three of the available bands in a multiband raster dataset can be used to create RGB composites for the map display. When you display bands together as RGB composites, often more information is available from the dataset than if you display only one band.

A satellite image, for example, commonly has multiple bands representing different wavelengths from the ultraviolet through the visible, near-infrared, and shortwave infrared portions of the electromagnetic spectrum. Landsat-9 imagery, for example, is data collected from 11 bands of the electromagnetic spectrum. Bands 1 through 7, represent data from the visible, near-infrared, and midinfrared regions. Band 6 collects data from the thermal infrared region. Another example of a multiband image is a natural color orthoimage in which there are three bands, each representing either red, green, or blue light.

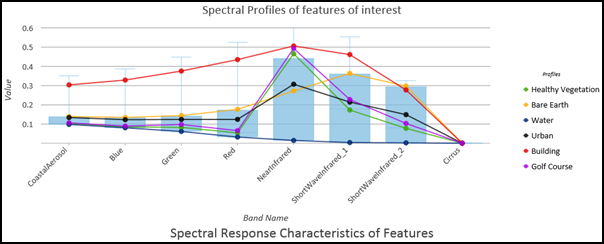
There are many analysis possibilities with raster bands to observe and measure phenomena that are both visible and invisible to the human eye. Different materials and features reflect and absorb energy in different portions of the electromagnetic spectrum, known as their spectral signature or profile.
Sensors are designed to record energy in specific portions of the electromagnetic spectrum corresponding to the spectral profile of common features of interest, such as water, human-made features, and vegetation. For example, many sensors record near-infrared energy (750–1,000 nm), which is important for analyzing and monitoring vegetation types, relative health, environmental stress, and other physical characteristics and phenomena. Other bands, and band combinations, are well suited for identifying and quantifying land-use and land-cover classes for a wide variety of applications.

With different raster band combinations, visualizations are created that allow different analyses of imagery. Each visualization provides a different view of the imagery in which specific phenomena can be observed and measured. For instance, when studying vegetation, a raster band combination using infrared bands displays healthy vegetation, while shortwave infrared bands may be better for other geologic studies. Any combination of three bands in an image can be created for a custom visualization. For some images with an alpha band, the fourth band can be used for transparency but will not be seen in the legend for the image. There are several preset band combinations available in ArcGIS Pro based on the raster bands in the image. Common band combinations are Natural Color and Color Infrared. For satellite sensors with additional raster bands, including shortwave infrared and thermal bands, additional band combinations are available.
The science of remote sensing is based on processing multispectral image bands to extract data and information about features and phenomena. The image processing tools, functions, and capabilities in ArcGIS Pro are based on remote sensing and photogrammetric concepts, and understanding and managing image bands is central to analytical and visual analysis of imagery. Multispectral bands can be related, combined, and processed using arithmetic operations to derive specific types of features. Some standard algorithms and processes are well known, and are called indices. These indices are categorized by application, such as Vegetation and Soils, Water, Geology, and Landscape.