ArcGIS Pro is a ribbon-based application. Many commands are available from the ribbon at the top of the ArcGIS Pro window; other functionality is found on context menus and panes (dockable windows) that can be opened as needed. ArcGIS Pro responds contextually to your work. New tabs may appear on the ribbon, and menu options may be enabled, depending on the item you're working with and its properties.
Overview
- This video was created with ArcGIS Pro 3.4
In this tutorial, you'll explore the main components of the ArcGIS Pro user interface—the ribbon, views, and panes.
- Estimated time: 30 minutes
- Software requirements: ArcGIS Pro Basic
Note:
The quick-start tutorials are updated at each software release. For the best experience, use an online help version that matches your software version.
Open the project
You'll explore an ArcGIS Pro project containing 2D and 3D maps of Wellington, New Zealand.
- Start ArcGIS Pro. If the ArcGIS Sign In window appears, enter your ArcGIS organization username and password and click Sign In.

When the Sign in automatically box is checked, you don't need to sign in the next time you start the application. Once you sign in, the ArcGIS Pro start page appears. It appears immediately if you sign in automatically.

Element Description 
Your profile name and ArcGIS organization appear at the top of the ArcGIS Pro window.

You create and open projects on the Home tab
 of the start page. Tutorials and other help are available on the Learning Resources tab
  . On the Settings tab
  , you can set options for ArcGIS Pro and access application-wide functionality.
Start a new project. Four templates are provided; each opens the new project in a different state. You can open a blank project by starting without a template.

Open a project from the list of recent projects.

Browse to or search for a project that is not in the recent projects list.
ArcGIS Pro start page elements on the Home tab - Open a browse dialog box to search for the project in one of the following ways:
- On the start page, click Open another project
 .
. - In an open project, click the Project tab on the ribbon. In the list of side tabs, click Open. On the Open page, click Open another project
 .
.

- On the start page, click Open another project
- On the Open Project browse dialog box, in the navigation pane, under Portal
 , click ArcGIS Online
  .
.Note:
If you are signed in to ArcGIS Enterprise
 , you must set your active portal to ArcGIS Online to access the tutorial data. If you can't do this, you can download the data from a browser.
 - In the search box at the top of the dialog box, type Introducing ArcGIS Pro v340 and press the Enter key.

Your search results may be different, but the Introducing ArcGIS Pro v340 project package should be present. - In the list of search results, click Introducing ArcGIS Pro v340 to select the project package.
Note:
If there is more than one project package with this name, select the package with the Authoritative badge
 . In the Owner column, the owner name is ArcGISProTutorials. If you don't get any results, see No search results are returned.
 - Click OK.
When the project opens, you see a zoning map of Wellington, New Zealand. The map appears in a window called a view. The blue tab at the top of the view indicates that the view is active.
The Contents pane displays the map contents. The map is named Wellington City and contains several layers of data, such as Zoning and City Boundary.

Element Description 
The Quick Access Toolbar has common commands. For example, you can save the project or undo an action.

The ribbon consists of a series of tabs. Each tab, such as the Map tab, has its own set of commands.

A view can display a map, a layout, a table, a chart, or another item.

The Contents pane shows the contents of the active view.

The Catalog pane provides access to data and other items used in the project.
Common elements of the user interface of a project Learn more about the ArcGIS Pro user interface
The ArcGIS Pro user interface is configurable, and its configuration is maintained between projects. For this reason, your project may look different. For example, you may see additional panes, or your panes may be arranged differently.
- On the ribbon, click the View tab. In the Windows group, click Reset Panes
 and click Reset Panes for Mapping (Default).
This ensures that the Contents and Catalog panes are open and that all other panes are closed. It does not change the position of panes.
The Contents pane lists items in the active view, such as the layers in a map or the layout elements in a layout. The Catalog pane lists items that belong to the project, such as databases, toolboxes, and folder connections.
Tip:
On the View tab of the ribbon, in the Windows group, you can also click Catalog Pane
 or Contents
  to open these panes.
Close and open views
A project may contain many maps, scenes, and layouts. Some may be open and others closed. Only one view is active at a time. In this project, there are four open views.
- Click the view tab of the Central Wellington map
 to make it active.
The map shows buildings in the city center symbolized by their solar energy potential. Dark orange buildings receive the most sunlight and yellow buildings receive the least.
- Click the view tab of the Central Wellington_3D local scene
 to make it active.
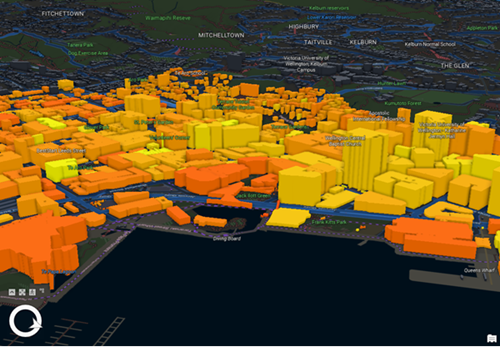
Central Wellington_3D is a local scene that shows the buildings in 3D. A scene in ArcGIS Pro can be local or global.
Tip:
If a map or scene does not redraw completely when you open it or make it active, click Refresh
 at the bottom of the view.
 - Click the view tab of the Wellington Solar Energy Potential layout.
The layout is based on the Central Wellington map. When a layout view is active, the Contents pane displays the layout page elements, such as map frames, legends, scale bars, and text.
- Click the view tab of the Wellington City map to make it active again.
- Click the Close button
 on its view tab.
The map view closes, but the map is not deleted from the project.
- In the Catalog pane, expand the Maps container.
 .
.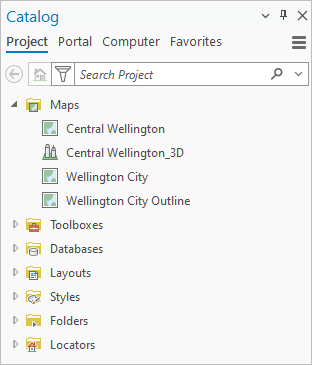
The project contains three maps and a local scene. The Wellington City Outline map, which is used for the inset map in the layout, is not open.
- Right-click the Wellington City map and click Open.
The map reopens and becomes the active view. Its view tab is positioned next to the Wellington Solar Energy Potential view.
Tip:
To remove a map or layout permanently from a project, right-click the item in the Catalog pane and click Delete
 .
. - On the ribbon, click the Map tab.
Explore the map
The ribbon has a set of core tabs that are either always present or always present when a certain type of view is active. For example, the Map tab is present whenever a map is the active view.
Each tab has its own tools, organized in groups. The Map tab has tools for interacting with the map. On the Map tab, in the Navigate group, the Explore tool  is selected by default.

The Explore tool is a split tool. Clicking the top half performs an action (getting information about map features). Clicking the bottom half opens a drop-down list of choices that adjust the tool's behavior. When the Explore tool is selected, you can navigate the map by panning and zooming.
- Hover over the Wellington City map.
The mouse pointer changes to a hand. You can drag the map to pan it.
- Drag the map in different directions.
Pan as far as you want in any direction. You'll use a bookmark to return to your starting place.
Tip:
You can roam around the map by holding the Q key on the keyboard while moving the pointer in the direction you want to go. Press Shift+Q to decrease the roam speed; press Ctrl+Q to increase the speed.
- On the ribbon, on the Map tab, in the Navigate group, click Bookmarks
 . Under Wellington City Bookmarks, click Wellington.
The map returns to its original extent.
- On the Map tab, in the Navigate group, click Fixed Zoom In
 three or four times.
The map zooms in to a larger scale and you can see more detail.
- Click Fixed Zoom Out
 once or twice.
As you zoom in or out, the map scale changes. The map scale is displayed in the scale box at the bottom of the view.
- On the map scale box at the bottom of the view, click the drop-down arrow and click 1:24,000.

The map zooms to a scale of 1:24,000. (If this scale does not appear on your list, choose a different one.)
- In the Contents pane, right-click the City Boundary layer and click Zoom To Layer
 .
.The map zooms to the city boundary.
Tip:
You can use the scroll button on your mouse to zoom in and out.
- On the map, click anywhere inside the city boundary.
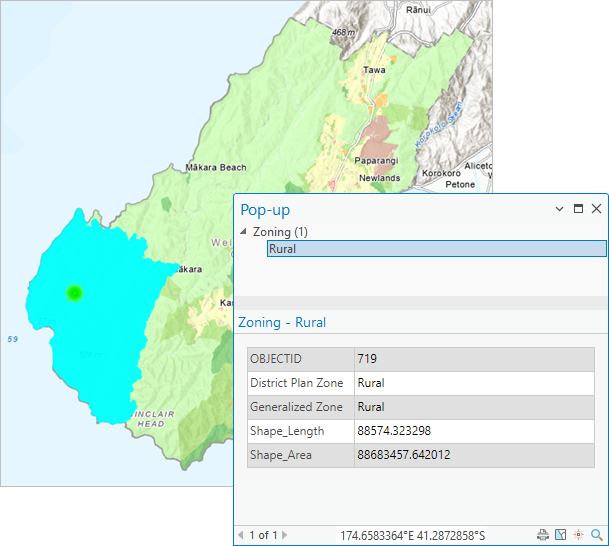
A feature in the Zoning layer flashes on the map. The Pop-up pane appears with the feature's zoning designation.
- Click some other features in the Zoning layer to see their pop-ups.
- At the top of the Pop-up pane, click Close
 to close the pane.
Work with feature attributes
The information that appears in pop-ups for features in the Zoning layer is stored in an attribute table. There is a one-to-one correspondence between features on the map and records in the table.
- In the Contents pane, click the Zoning layer to select it.
On the ribbon, three tabs are outlined in white. These are contextual tabs—they appear when ArcGIS Pro is in a state to make use of them. For example, when a feature layer is selected in the Contents pane of a map, the Feature Layer, Labeling, and Data tabs appear.
- On the ribbon, click the Data tab. In the Table group, click Attribute Table
 .
.
The layer's attribute table opens in a view. Each row in the table corresponds to a feature in the layer. Each column is an attribute, or category of information. For example, the table has two zoning attributes: District Plan Zone and Generalized Zone.
By default, the table view is docked below the map. It may partially block your view of the map.
Tip:
The default docking position of some views can be changed in the user interface options.
- Drag the table view by its view tab away from its docked position.
As you drag the view over the application window, its position is represented by a semitransparent blue rectangle. If you hover over the map, docking targets appear.
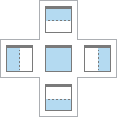
- Drag the table view to a location that is not on a docking target and release the mouse button.
The view now floats over the application window.
- If necessary, drag the view to a location that does not block your view of the map. Optionally, resize the view by dragging its sides or corners.
Tip:
You can minimize a floating view by clicking the Minimize button at the top of the view. A minimized view is open but not visible on the screen. To restore a minimized view, hover over the ArcGIS Pro icon in the Windows taskbar and click the view.
- In the table, click the gray square numbered 1 at the edge of the table to select the first row.
The row is highlighted in the table and its corresponding feature—part of Wellington International Airport—is selected and highlighted on the map in the southeastern part of the city.
- Hold the Shift key. In the table, click the gray square numbered 5.

Five records are selected in the table—all those with the zoning designation of Airport. The corresponding map features are also selected.
Suppose you want to see all the areas that have a certain zoning designation, such as Conservation. You could scroll through the table and select them manually, but there is a better way.
- On the ribbon, click the Map tab. In the Selection group, click Select By Attributes
 .
.The Select By Attributes window appears. You'll create a query to select the features you want to see on the map.
- In the Select By Attributes window, confirm that the Input Rows parameter is set to Zoning and the Selection Type parameter is set to New Selection.
- In the expression builder, click the Where drop-down arrow and click Generalized Zone.
Additional boxes appear in the expression builder.
- Confirm that the logical operation is set to is equal to. To complete the expression, click the empty drop-down list of generalized zone values and click Conservation.

- Click OK.
At the bottom of the table view, you can see that 48 of 2,289 records are selected. The corresponding features are selected on the map.
- At the bottom of the table view, click Show Selected Records
 to show only the selected records.
 - At the bottom of the table view, click Show All Records
 to show all records again.
 - On the ribbon, on the Map tab, in the Selection group, click Clear
 to deselect all records and their corresponding map features.
 - At the top of the table view, click Close
 .
. - On the Quick Access Toolbar, click Save Project
 .
.
Work with layer symbology
You can change the symbols that represent features in a layer. You can also change the basemap that provides background context for other layers.
- Click the view tab of the Central Wellington map to make the map active.
- On the ribbon, on the Map tab, in the Layer group, click Basemap
 .
.A drop-down gallery of basemaps appears.
- In the basemap gallery, scroll down and click Firefly Imagery (Hybrid).
The previous basemap, the Human Geography Dark basemap, is replaced by an imagery basemap. In the Contents pane, there are two layers associated with this basemap: the World Imagery (Firefly) layer at the bottom of the list of layers and the Hybrid Reference Layer, which contains place name labels, at the top.
- In the Contents pane, click the Parks layer to select it.
- On the ribbon, click the Feature Layer tab. In the Drawing group, click Symbology
 . Click the top half of the split button. If you click the drop-down arrow, click Single Symbol.
The Symbology pane appears with options for setting layer symbology. The primary symbology type is Single Symbol, which means that all features in the layer have the same symbol—in this case, a partially transparent green color.
Typically, new panes are stacked on top of the Catalog pane. You can tell stacked panes apart by the name and icon at the bottom of the pane.
Tip:
You can float and dock panes in the same way as views. If a pane is stacked, drag it by its view tab to a new position. If it is not stacked, drag it by its title bar.
- In the Symbology pane, click the green symbol.
The pane presents options for formatting polygon symbols. At the top of the pane are a Gallery tab and a Properties tab. On the Gallery tab, you can choose a predefined symbol from the styles, such as ArcGIS 2D, that are added to the project. On the Properties tab, you can modify symbol properties, such as color and outline width.
- Click the Gallery tab if necessary.
- In the search box, type park and press the Enter key.
In the ArcGIS 2D style, several park and cemetery symbols are found. You can hover over the symbols to get more information about them.
- Click any park symbol to select it.

The symbol updates in the Contents pane and on the map.
- On the Quick Access Toolbar, click Save Project
 .
.
Navigate a scene
You can navigate both maps and scenes by panning, zooming, and using bookmarks. You can tilt and rotate scenes to view data from 3D perspectives.
- Click the view tab of the Central Wellington_3D scene to make the scene active.
- On the ribbon, on the Map tab, in the Navigate group, click Bookmarks
 . Under Central Wellington_3D Bookmarks, click Jervois Quay.
- Click Bookmarks
 again and click View from Lambton Harbour to view the scene from another perspective.
 - Drag the scene to pan in any direction.
- On the Map tab, in the Navigation group, click Fixed Zoom In
 and Fixed Zoom Out
  . Alternatively, use the mouse wheel to zoom in and out.
In the lower left corner of the view, the on-screen navigator provides additional controls.
- Hover over the on-screen navigator and click Show full control to expand the navigator.

- Drag the central sphere to look around in all directions from a stationary point.
- Drag the inner ring up and down to tilt the scene. Drag the inner ring left or right to rotate the scene.
- If you become disoriented, return to one of the Central Wellington_3D bookmarks.
- Optionally, try some of the other on-screen navigator controls.
- When you're finished, hover over the on-screen navigator and click Show heading (the same button as Show full control) to restore the navigator to its default appearance.
- On the Quick Access Toolbar, click Save Project
 .
.
Modify a layout
In this section, you'll make a changes to the layout legend.
- Click the view tab of the Wellington Solar Energy Potential layout to make the layout active.

A layout includes one or more map frames, representing maps or scenes in your project; map surrounds, such as legends, scale bars, and north arrows; text; and sometimes pictures or graphic elements.
This layout has two map frames. The main map is the Central Wellington map and the circular inset map is the Wellington City Outline map. (Earlier in the tutorial you saw this map in the list of maps in the Catalog pane, but you did not open it.) Note that the Central Wellington map in the layout displays the imagery basemap you applied to the map view.
The ribbon has changed to show tabs and tools for working with layouts. The Map tab is replaced by the Layout tab and the Edit tab is gone.
The Contents pane lists the layout elements: the map frames, the legend, the text elements, and so on.
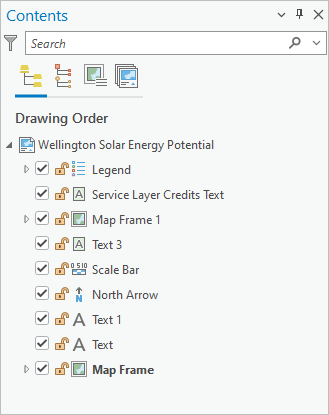
By default, the elements are listed in their top-to-bottom drawing order. You can use the graphic tabs at the top of the Contents pane to organize them in different ways.
- In the Contents pane, click List By Element Type.

The layout elements are now grouped by type. This may help you find an element you want to work with.
- Click List By Map Frame and expand the two map frames.
In this grouping, you see the layers in each map and the map surrounds associated with each map frame. In this layout, the legend, north arrow, and scale bar are all associated with the map frame that contains the Central Wellington map.
- Click List By Drawing Order to return to the default grouping.

You'll add a border to the legend to help it stand out on the layout.
- In the Contents pane, right-click Legend and click Properties
 .
.The Element pane appears with properties and settings for the legend.
- At the top of the pane, on the Legend tab, click the drop-down arrow and click Border.
- On the Symbol tab
 , under Appearance, click the Color drop-down arrow and click Gray 40%.
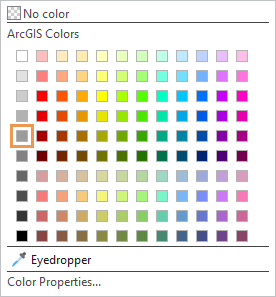
- Increase the line width to 2 pt. At the bottom of the pane, click Apply.
- At the top of the pane, click the Layers tab
 . Expand Offset effect and increase the offset to 5 pt. Click Apply.
Notice that the symbol for parks is listed above the symbols for buildings. Since the layout's purpose is to convey information about the solar potential of the buildings, it would be better if the building symbols appeared first.
- In the Contents pane, expand the Legend element if necessary, and drag the Buildings legend item above Parks.
As you drag, the position of the legend item is represented by a thin horizontal line. When you release the mouse button, the legend is updated on the layout.
- In the Contents pane, click Wellington Solar Energy Potential at the top of the drawing order to deselect the legend element.

- On the Quick Access Toolbar, click Save Project
 .
.
In this tutorial, you became familiar with key components of the ArcGIS Pro user interface, including the ribbon, views, panes, and the Quick Access Toolbar. You navigated a map and a scene, got information about features through pop-ups, made a feature selection with an attribute query, changed layer symbology, and modified a layout legend. You can explore these activities in more depth in other quick-start tutorials.
