Synthetic Aperture Radar (SAR) data that has been Radiometrically Terrain Corrected (RTC) can be used to detect flooded areas. Once you have prepared your Sentinel-1 Ground Range Detected (GRD) data as analysis-ready RTC data, you can use it for analysis and interpretation.
Dual Polarized Analysis Ready Sentinel-1 GRD Data
In this scenario, a hurricane recently caused flooding along the coast and inland. Using pre- and post-hurricane SAR RTC data, you can detect flooded areas by analyzing the backscatter for a copolarized band and a cross-polarized band. Low backscatter values correspond to dark colors while high backscatter values correspond to bright colors. The backscatter observed here is specific to C-band wavelength SAR data and can vary for other wavelengths.
Type of scattering
There are four main types of scattering: double-bounce, volume, diffuse, and single-bounce.
In double-bounce scattering, the radar signal reflects once off a vertical target onto a smooth surface and reflects a second time off the smooth surface back toward the sensor. For this scattering path, the polarization is not altered and causes a high backscatter in the copolarized band and a low backscatter in the cross-polarized band.

In volume scattering, the radar signal reflects off a 3D feature multiple times, changing polarization randomly during the reflections. Volume scattering can take place within canopies of short or sparse vegetation such as bushes, shrubs, or agricultural crops.

In diffuse scattering, the radar signal reflects once off a rough surface and is scattered in various directions. The rougher the surface, the higher the copolarized backscatter.
In single-bounce scattering, also known as specular reflection or forward scattering, the radar signal reflects once off a smooth surface, reflecting in a perpendicular direction relative to the original signal.

False color SAR composite
A common way to analyze dual polarized SAR RTC is to create a false color composite. A color composite uses band combinations for the red, green, and blue display channels to create a false color image. Common dual polarized SAR combinations are VV for red, VH for green, and VV/VH for blue, or alternatively, HH for red, HV for green, and HH/HV for blue. These band combinations are useful because they highlight differences in scattering behavior, which allows you to infer information about the surface characteristics. These combinations also commonly render forests and dense crop canopies in green and water bodies in blue.
The Create Color Composite tool allows you to create a false color image by allowing you to define the bands for RGB. You can use band algebra expressions for each of the band expression parameters. To define the band math using the names of the bands, select Band names for the Method parameter. The band math used will depend on the units of your input SAR RTC data. If your input SAR RTC is in linear units, use VV for red, VH for green, and VV/VH for blue. If your input SAR RTC is in decibels (dB), the band combination should be VV for red, VH for green, and VV-VH for blue.

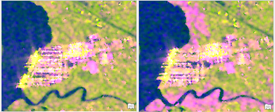
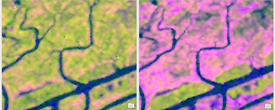
Below are examples of pre- and post-hurricane color composites using R: VV, G: VH, B: VV-VH in units of decibels. The color composites show water bodies including the ocean and rivers in blue, urban structures in yellow, vegetated and forested regions in greens, and flooded vegetation in the wetlands in pink. There are also some optimally oriented urban structures in pink.
Note:
When displaying your SAR RTC images, it is recommended that you use the Standard Deviation stretch type, using a standard deviation value of 1.

Interpretation of the areas of interest
The four areas of interest (AOI) that will be interpreted are described in the following table:
| AOI | Interpretation |
|---|---|
 | The green pixels |
 | The yellow pixels The pink pixels The new pink pixels observed in the post-hurricane image are flooded vegetation. These newly flooded pixels are observed in the north along the coast |
 | The blue pixels |
 | The green pixels |
 correspond to diffused scattering from grass. The blue pixels
  correspond to single-bounce scattering from a smooth airport tarmac and runways. The backscatter for this region does not change for the pre- and post-hurricane color composite. The consistent backscatter means the area was not flooded in the post-hurricane image.
 adjacent to the blue pixels correspond to double-bounce scattering and volume scattering from ships in port. The yellow and white pixels
  correspond to double-bounce scattering and volume scattering from shipping containers oriented orthogonally to the radar look direction.
 in the pre-hurricane image correspond to double-bounce scattering from urban structures in the port that are oriented orthogonally to the radar look direction. These pixels are pink instead of yellow because little volume scattering occurs due to the structures being sparsely spaced.
 and in the south along the riverbanks
  .
. correspond to
single-bounce scattering from permanent water bodies. The backscatter does not change in the pre- and
post-hurricane images.
 correspond to volume scattering from vegetation. The pink pixels
  correspond to double-bounce scattering from flooded vegetation in the wetlands. From the pre- to post-hurricane image, the number of flooded vegetation pixels increases due to flooding from the hurricane.